
HP Integrity Virtual Machines Manager Version 4.0 Getting Started Guide

categories of data. In the Capacity Advisor graphs, you can view utilization data for both
CPUs and memory. You can also view network and disk bandwidth utilization (throughput)
for whole OS profiles. For more information about the Capacity Advisor Profile Viewer, see
the HP Capacity Advisor Version 4.1 User's Guide or the Capacity Advisor Profile Viewer Screen
help topic.
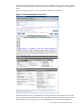
When you click the View→Capacity Ad visor Data... menu item without any virtual machines
selected on the current tab, the screen shows utilization data pertaining to the VM Host.
The data provided by the View→Capacity Advisor Data... menu item is similar to what is
provided by clicking on a utilization meter. However, clicking on a meter presets certain
parameters, such as what type of utilization metric to display and for which system (VM
Host or a particular virtual machine, for example). Nevertheless, you can change parameters
once the screen comes up.
• When using VM Manager through VSE Management Software under HP SIM, you can use
the Tools→Capacity Advisor Historic Report menu item to create a comprehensive report
that collects and analyzes data over specified time periods from specified sources, as described
in “Creating a Historical Utilization Data Report” (page 72). The report can be browsed and
saved.
Creating a Historical Utilization Data Report
To use HP Capacity Advisor to create a historical utilization report that includes data for the
target workloads, systems, complexes, or scenarios you specify, select the Tools→Capacity
Advisor Historic Report menu item from the VM Manager menu bar. This menu item is available
only when you use VM Manager with VSE Management Software through HP SIM; it is not
available when using VM Manager through HP SMH. Before creating a report, you must have
collected data on the systems of interest (see “Enabling Collection of Utilization Data” (page 68)).
HP Capacity Advisor reports provide information about utilization and allocation data that have
been collected and analyzed. This facility gives you the flexibility of analyzing and showing data
collected over specified time periods. A wizard allows you to set a variety of parameters to
determine the time periods and systems for data collection and analysis. The report can be
browsed (the screen is presented in a new browser window) and saved. In contrast, the
View→Capacity Advisor Data... menu item gives a snapshot of utilization that's more limited
to the current, most recent time period.
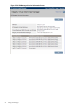
Capacity Advisor collects data for the following resources or targets: systems, workloads,
complexes, and scenarios. For these targets, Capacity Advisor provides utilization information
in the following reports:
• System Utilization Report
• Workload Utilization Report
• Complex Utilization Report
• Scenario Utilization Report
Viewing Integrity VM Host and VM Logs
You can view the events logged by Integrity VM pertaining to the VM Host and all guests by
selecting View→Integrity VM log for VM Host... from the VM Manager menu bar. This gives
the same display that the hpvmstatus -e command would give when used at the Integrity
VM CLI. The VM Host event log records all changes to configurations of the VM Host and to
virtual machines on the VM Host, including information about commands issued and error
messages.
You can view the events logged by Integrity VM pertaining to a selected virtual machine by
selecting View→Integrity VM log for VM... from the VM Manager menu bar (if you are in a VM
Host or Vswitch Properties view, a virtual machine must be selected). This gives the same display
that the hpvmstatus -e -P vm-name command would give when used at the Integrity VM
72 Using VM Manager