
HP Integrity Virtual Machines Manager Version 4.0 Getting Started Guide


6
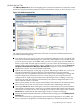
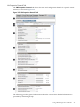
The meter (bar graph) displays network I/O throughput data, if available. The data is a
5-minute average that is calculated and updated on 5-minute boundaries. If the data cannot
be displayed, the meter is dimmed as in this example, and a label indicates the probable
cause. For a description of meter labels, see “Utilization Meter Status/Error Information”
(page 92).
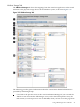
Using VM Manager with HP SIM and VSE Management Software, you can click a meter to
view a snapshot of HP Capacity Advisor historical data for network I/O; this feature is not
provided when using VM Manager from HP SMH.
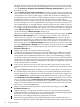
For more information about using VM Manager to collect and view utilization data, see
“Collecting and Viewing Utilization Data” (page 68).
7
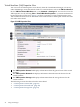
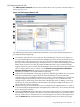
Indicates by color coding that matching components are related.
50 Using VM Manager