
HP Virtualization Manager 6.0 Software with Logical Server Management User Guide
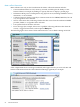


Table Of Contents
- HP Insight Virtualization Manager 6.0 Software with Logical Server Management: User Guide
- Table of Contents
- 1 Introduction
- 2 Getting started with Virtualization Manager
- 3 Working with logical servers
- Using logical servers in Virtualization Manager
- New features in logical servers
- Understanding logical servers as they appear in visualization perspectives
- Logical server operations
- Authorizations, requirements, and configuration
- Logical server requirements
- Configuring and registering VMware vCenter
- Configuring VMware vSphere client settings for browsing datastore
- Configuring HP SIM with Onboard Administrator credentials
- Configuring HP SIM for SAN storage validation
- Configuring Extensible Server & Storage Adapter (ESA)
- Configuring Storage Provisioning Manager (SPM)
- LSMUTIL database utility
- 4 Defining storage for logical servers
- 5 Troubleshooting
- Navigation tips
- User preferences tips
- Performance tips
- Problems with meters collecting data
- Search button displays error page
- Displaying empty, hidden resource pools
- Errors accessing single sign-on iLO or Onboard Administrator
- Recovery after logical server operation failures
- Troubleshooting an inoperable logical server
- Correcting problems powering on a logical server
- Logical server operations cannot be cancelled
- Logical Server Automation service fails to start if TCP layer ports are in use
- Use portable WWNs and MAC addresses for Virtual Connect domain groups
- Do not use valid host name as logical server name
- Oversubscribing the number of networks
- Insufficient NICs error when activating or moving logical servers (Virtual Connect Flex-10 support)
- Use caution when renaming or moving a Virtual Connect domain group
- Deactivate or move logical servers before replacing blade
- Unmanaging a logical server using a storage pool entry may result in an inconsistent state
- Synchronize clocks on the CMS, managed systems, and VMware vCenter
- Ensure VM Hosts use fully qualified host names
- VM Hosts must be in same vCenter for ESX virtual machine logical server moves
- VM displayed without association in Virtualization Manager perspectives after deactivation
- Moving logical servers when the CMS and vCenter are in different network domains
- Changing the IP address of a VM Host after logical server discovery prevents the VM Host from appearing as an activation and move target
- Creating and managing logical servers on Microsoft Windows Hyper-V Server 2008
- 6 Advanced features
- 7 Support and other resources
- Index
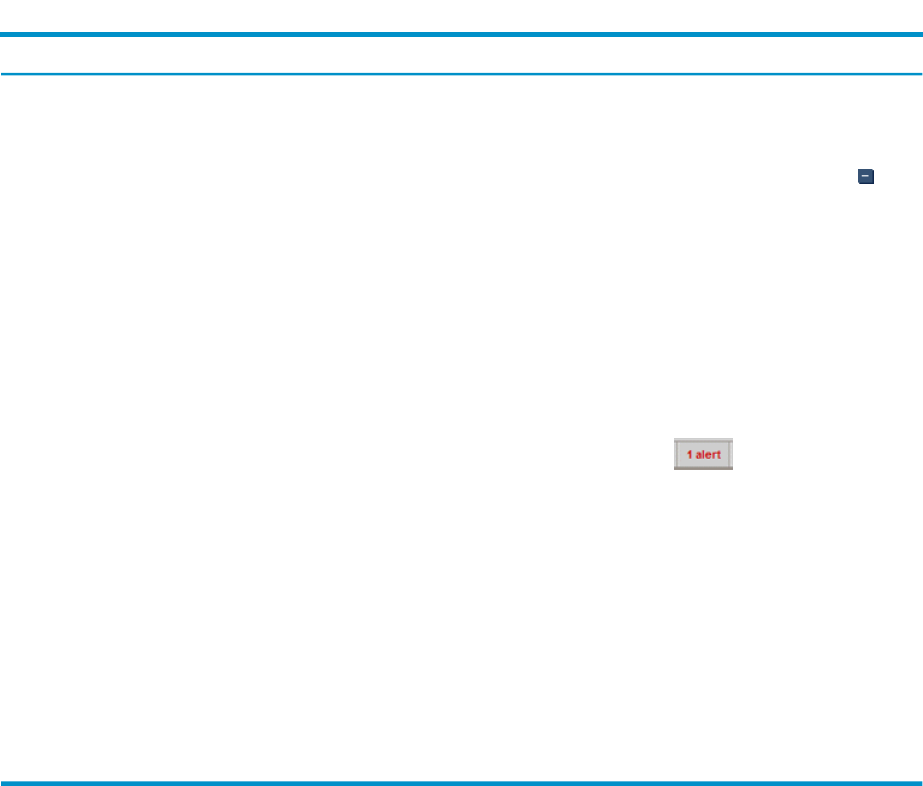
Table 6-1 User preference settings and defaults (continued)
What it doesDefaultSettingUser preference
On the Visualization tab, this setting detects the number of
visible compartments to display. If the number of
compartments exceeds the defined limit, Virtualization
Manager collapses the compartments in the layout. This action
is equivalent to clicking the Toolbar Collapse button . The
end result is that some compartments (earlier in the sort
order) are expanded and later ones are collapsed.
NOTE: Auto collapsing is turned off by default (that is, the
maximum number of compartments, 5000, is allowed). To
improve loading performance, set this value to a lower
number. Setting the value to 1 has the same effect as setting
the “Collapse top level compartments by default” preference
to Yes.
5000Minimum =1;
Maximum =
5000
Maximum number of
compartments to
display before
auto-collapsing
Controls the number of warnings/errors the Virtualization
Manager tracks. These are displayed on the Virtualization
Manager toolbar as an alert .
100Minimum =1;
Maximum =
500
Maximum number of
alerts to display
On the Workload tab, controls the number of workloads that
display by default. Note: Choose to display fewer workloads
for highest performance.
50Minumum = 1,
Maximum =
200
Number of workloads
to display per page on
workload tab?
Allows you to set a default collection to display by default
on the Visualization tab each time you access the
Virtualization Manager from the HP SIM Tools menu. Use
the drop-down menu to select a specific collection (for
example, nPartitions, Blades, Standalone servers, VM Hosts,
Enclosures, and so on) or all nodes by keeping the default
“All VSE Resources.”
NOTE: To see this change take effect, from the HP SIM
menu bar, select Tools→Virtualization Manager...
All VSE
Resources
Select among
available
collections
Default collection for
Tools→Virtualization
Manager...
When you are finished modifying the default user preferences, you have the following options:
• Click OK to change and save your user preferences for this and subsequent sessions.
• Click Cancel to return to your previous page, without saving or changing any preferences.
• Click Restore Defaults to reset the preference values in the current tab to the default values,
and remain on the User Preferences page.
Reviewing real-time utilization data
This section describes the available utilization metrics that are visible in the Virtualization
Manager and actions you can take to access utilization data from the Virtualization Manager.
Utilization metrics visible in Virtualization Manager
The Virtualization Manager displays real-time utilization metrics from the managed systems.
Utilization metrics graphically display as meters in a Visualization View compartment or as a
row in the table in the Workload View. The meters show CPU utilization, memory utilization,
network I/O, and disk I/O (see “Available utilization metrics” (page 93)). Power meters are
provided for any physical server, including standalone servers, nPartitions, or server blades.
Power meters typically display a warning triangle until a power calibration has been performed
for a system. Once calibrated, the power meter value can be displayed. You can link to the power
calibration task is when it is present in the meter callout or from the Configure→Calibrate
Power (All Selected Systems)... menu option. For information on the meter callout, see “Meter
callout information” (page 94). For information on Configure menu options, see Configure Menu.
Reviewing real-time utilization data 91