
HP Capacity Advisor 7.0 User Guide

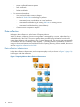


Table 1 Collection methods by operating system on CMS and managed node types (continued)
Collector for HP-UX CMSCollector for Microsoft Windows CMS
Managed node software and/or
OS
Integrity Virtual Machines Provider and
Utilization Provider
Integrity Virtual Machines Provider and
Utilization Provider
HP-UX on Integrity Virtual
Machines
Utilization ProviderUtilization ProviderOpenVMS on Integrity Virtual
Machines
Utilization Provider (Integrity only)agentless methodstandalone Windows
agentless SSHagentless SSHstandalone Linux
Utilization ProviderUtilization Providerstandalone HP-UX
Utilization ProviderUtilization Providerstandalone OpenVMS
1
Data is obtained from some managed system types using more than one collector. This is done where the data from both
collectors provide a broader or more accurate view than can be obtained from using only one collector on that managed
system type. For example, where both natively collected data (agentless) and data from the HP Integrity Virtual Machines
Provider are used, the Integrity VM agent provides info about the VM that allows Capacity Advisor to obtain more
accurate CPU data for the VM, and the agentless method provides metrics other than CPU utilization.
Comparison of agentless and UP data collection
Table 2 (page 16) compares the operational characteristics of agentless data collection and that
of the Utilization Provider when used to collect data from systems licensed for Capacity Advisor.
• Agentless Data Collection. This method leverages native data collection already occurring on
the managed server(s).
• WBEM Utilization Provider. This method uses an agent to gather the data and provide it to
the CMS.
Table 2 A comparison of agentless data collection and use of Utilization WBEM Provider
Utilization ProviderAgentless data collection
Equally useful in data quality and accuracy.
Available for HP-UX and OpenVMS systemsAvailable for Microsoft Windows, Linux, and non-HP
systems
Provides the basic set of resource utilization metrics for
CPU, memory, network I/O, and disk I/O.
Provides the basic set of utilization metrics for CPU,
memory, network I/O, and disk I/O, plus additional
metrics for reporting specific activities in the operating
system, disk, and network: CPU queue length, page
faults/second, disk I/Os per second, LAN packets/second,
number of disks, disk space total, disk space used.
Requires hosting and updating the Utilization Provider
agent
Leverages existing data on the system; no additional agent
hosting or update required
Not susceptible to downtime in the network or the CMS.
Collected data is held for a maximum of 30 days by the
Utilization Provider for transfer to the database on the CMS
Susceptible to network or CMS downtime as data is
continuously collected by the CMS across the network from
each managed system
Slight additional load on CMS CPU or memory resources
incurred by the ongoing operation of the UP.
Small additional load on the CMS CPU and memory
resources incurred by the ongoing operation of the
agentless data collection service
Slight additional load on managed system resources, due
to local queries from the Utilization Provider agent every
Slight additional load on managed system resources due
to remote queries from the collector every 5 minutes
5 minutes, and storage/retrieval of historical metrics on
the local file system
16 Features