
HP Matrix Operating Environment Chargeback

Technical white paper | HP Matrix Operating Environment Chargeback
15
To display these new attributes, it is important to understand where the desired attributes are located in the source XML
structure. In this case, the attributes are located inside the <serviceInformation> element under each service that is
represented by the <ServiceUsageDetail> element. The following <xsl:value-of> elements need to be added
to the XSL file to display the new attributes. Note that the <td> element is only used because the attributes are being
added in an HTML table.
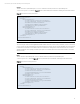
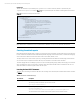
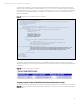
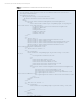
Figure 19. XSL elements to add to display additional service attributes
<?xml version="1.0" encoding="UTF-8"?>
<xsl:stylesheet xmlns:xsl="http://www.w3.org/1999/XSL/Transform" version="2.0">
<xsl:output method="html"/>
<xsl:template match="/">
<html><body>
<h2>Service Usage Detail Sample </h2>
<table border="1px" cellpadding="6px" cellspacing="0" style="font-family:
arial;font-size:16">
<tr bgcolor="blue" style="color:white;font-weight:bold">
<td>Service Name</td>
<td>Date</td>
<td>Fixed Cost</td>
<td>Organization</td>
<td>Billing Code</td>
<td>Owner Name</td>
</tr>
<xsl:for-each select="GetServiceUsageDetail/ServiceUsageDetail">
<tr>
<!-- Service data -->
<td><xsl:value-of select="serviceInformation/name"/></td>
<td><xsl:value-of select="date"/></td>
<td align="right"><xsl:value-of
select="resourceUsageDetail/fixedCost"/></td>
<td><xsl:value-of select="serviceInformation/organizationId"/></td>
<td><xsl:value-of select="serviceInformation/billingCode"/></td>
<td><xsl:value-of select="serviceInformation/owner"/></td>
</tr>
</xsl:for-each>
</table>
</body></html>
</xsl:template>
</xsl:stylesheet>
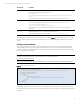
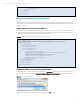
Following is an example of how Excel displays the source XML data when the preceding XSL is applied. For more details
about how to prepare the source XML file to use the XSL and how to open the file in Excel, see “Applying the formatter to the
source data.”
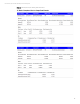
Figure 20. Excel report containing all service attributes
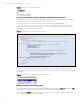
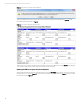
Creating a report to show all detailed service allocation metrics per day
This example shows a report that displays all infrastructure information including servers, disk and IP addresses. The XSL in
Figure 21 iterates on the infrastructure elements and their child elements, like servers and disks, to display allocation usage
and cost metrics.