
HP OSMS Blueprint: Directory Services on HP ProLiant and HP Integrity Servers with RHEL5
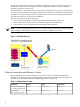
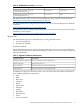
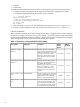


Table Of Contents
- HP Open Source Middleware Stacks Blueprint:
- Table of Contents
- Introduction
- Typographic Conventions
- HP Encourages Your Comments
- Overview of HP Directory Services OSMS
- Installing and Configuring Symas CDS and Apache Modules
- Managing the Symas CDS Server
- Performing Backups and Recovery with Berkeley DB
- Configuring the Master-Slave Replication
- Integrating the Apache HTTP Server with the mod_authnz_ldap and mod_ldap Modules
- Setting up Security for the CDS Server
- Monitoring OpenLDAP with the HP OpenView Operations CDS Gallery SPIs

• Unbind
• Write Waits
To enable the OpenLDAP-SPI monitor tools to work properly, perform the following steps.
1. Configure the monitor database of the respective LDAP server (OpenLDAP or CDS).
For example, add the following lines to the slapd.conf file:
# --- monitor backend
database monitor
access to dn.subtree="cn=Monitor"
by dn.exact="dc=example,dc=com" write
by users read
by * none
2. In the same file, slapd.conf, uncomment the line moduleload back_monitor.la.
3. Run the visudo command as root and comment out the line Defaults requiretty.
Event-Driven Methods
The event-driven methods are used to manage events that are triggered when certain conditions
are met, for example, if the CDS server process utilizes a greater percentage of CPU bandwidth
than the threshold defined in the policy. When a threshold is exceeded, warning messages appear
in the management console. Table 6 lists the CDS SPI policy details:
Table 6 CDS Policies in the OpenLDAP CDS Policy Group
Default
Threshold
Default
Polling
Interval
DescriptionPolicy TypePolicy Name
90%30 seconds
Monitors the CPU usage of the
CDS server. By default, if the CPU
utilization percentage of any CDS
process exceeds 90%, a critical
message is displayed in an active
message browser of the OVOW
console.
Measurement ThresholdCDS CPU—Usage
Monitor
90%30 seconds
Monitors the operating system's
memory usage of the CDS server.
By default, if the memory
utilization percentage of any CDS
process exceeds 90%, a critical
message is displayed in active
message browser of the OVOW
console.
Measurement ThresholdCDS Memory Usage
Monitor
N/A1 minute
Monitors a CDS process. If a CDS
process is killed, then a message is
displayed in an active message
browser of the OVOW console.
Scheduled TaskProcess Monitor—CDS
SPI
N/A5 minutes
Provides an interface for displaying
CDS server error messages. The
Open Message Interface policies
are used by other policies and are
not used directly for monitoring.
Open Message InterfaceStatus Message—CDS
SPI
34