
HP Intelligent Infrastructure Analyzer Software User Guide

NOTE:
• SFP monitoring and diagnostics are not performed for switches that do not meet the above
mentioned firmware requirements.
• The host where HP IIAS is installed, can connect to SAN switches over Ethernet continuously.
SAN Diagnostic GUI
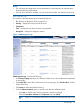
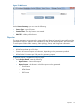
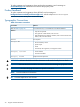
The columns in the table display the event attributes that are:
• ID – displays the diagnostic ID (for example: D1).
• Severity – displays the severity level of the event.
• Component
• Time – displays the time when the event was generated.
• Description – displays the diagnostic solution.
Figure 11 SAN Diagnostic Logs
SAN Diagnostic Logs, view lists the following:
• In the Rows per page drop-down list, select the number of rows of event that must be displayed
on each page.
• Click Select All to select all the check boxes in the current page, click Unselect All to unselect
all the check boxes.
• Click Delete to delete the selected event log.
• Click the Advanced Search option, to search events based on different criteria.
Select ALL or specific event severity to perform a search accordingly.◦
◦ Select the Start Date, End Date and Component and click Search.
NOTE: Search on a Component name does not include its sub-components logs in the
list.
Event Manager 23