
NonStop Server for Java 7.0 Tools Reference Pages
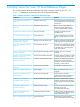


time_slice=<integer>
Specifies the time in seconds between the profiling start and the time when profiling will be
terminated. When the profiling is terminated, the profile data is written to a file. The application
will continue running. If time_slice is not specified, or if the application terminates before the
specified time elapses but the profiling has started, the profile data is written after the termination
of the application.
time_slice=sigusr1|sigusr2
Specifies which signal causes profiling termination and the profile data output. The signals for
profiling start and profiling termination can be the same. Specifying a signal and a timeout at the
same time is possible by repeating the time_slice option - termination of profiling occurs when
the first qualifying event takes place. The application continues running. Only one of the two signals
can be declared to use as the signal to terminate profiling. During the application's run, the signal
to terminate profiling can be delivered to the Java process multiple times. However, profiling is
terminated and a result file generated, if profiling is active when the termination signal is delivered.
file=<filename>
The profile data is written to the named file. If time_on=sig... has not been specified, the
default is java<pid> .eprof, where <pid> is the integer number representing the process ID
of the Java VM process. If a signal has been specified to start profiling, several data files are
created, with names java<pid>_<t>.eprof, where <t> is the time in seconds between the
application start and the profiling start.
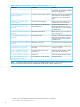
inlining=disable|enable
The compiler in the HotSpot VM optimizes Java applications by inlining frequently called methods.
Execution of inlined methods is not reported as "calls", since the actual calls have been eliminated.
Instead, the time spent in an inlined method is attributed to its "caller".
The default value for this option is enable. The other way of disabling inlining is to collect the
profile data while running the VM in interpreted mode (-Xint), although this is usually much
slower.
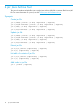
The consequences of inlining for the profiling are:
• The obtained profile data does not reflect faithfully all the calls within the Java code as written
by the programmer, but rather as it is actually executed by the VM. For most performance
analysis cases, this is a desired feature.
• As the calls within the Java application are eliminated, the corresponding calls to the profiler
are eliminated too, resulting in lower profiling overhead.
• The count of created objects cannot be reliably estimated from the call graph in the presence
of inlining, because the calls to the constructors may have been inlined.
ie=yes|no
Enables or disables the profiling intrusion estimation.
ie=yes, the default value, specifies that the profiler estimates the profiling intrusion and writes
the estimated values to the profile data file. HPjmeter uses this data to compensate for intrusion,
which means that the estimated intrusion is subtracted from the CPU times before they are presented
to the user. Disabling intrusion estimation slightly reduces the size of the data files, but also disables
the intrusion compensation feature. This option has no impact on the actual profiling overhead.
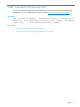
—Xverbosegc
The -Xverbosegc option prints out a detailed information about the spaces within the Java Heap
before and after garbage collection.
20 java: Java Application Launcher