
NonStop Server for Java 7.0 Tools Reference Pages
is a list of key[=value] arguments separated by commas.
The following options are used in most of the cases:
• For CPU time metrics with minimal intrusion:
-Xeprof
• Exact call count information and object creation profiling:
-Xeprof:inlining=disable
• To see the complete list of available options, use:
java -Xeprof:helps
After the profiled application terminates execution, the Java Virtual Machine writes the profile data
to a file in the current directory. Use HPjmeter to analyze the file.
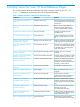
-Xeprof options
Generally, expect a two-fold decrease of your Java application performance when profiling with
-Xeprof. Depending on your JRE version or platform, dynamically enabling and disabling profiling
(see below) might introduce much higher overhead for several minutes. It is advised that the data
collection period is no shorter than 30 minutes.
The -Xeprof option needs to allocate memory to store the profile data. Therefore, it uses the same
memory pool as the JVM. If you specify a very large heap size (generally greater than 1GB), the
JVM may run out of address space before it runs out of memory.
off
Turn off -Xeprof profiling entirely. This is the default behavior for all SDKs up to 5.0.02. For SDK
5.0.03 and later, if no -Xeprof option is specified, it is equivalent to:
-Xeprof:time_on=sigusr2,time_slice=sigusr2
There is no degradation of performance unless you actually start profiling by the specified signal.
times=quick|thorough
The quick value instructs the profiler to use the hardware Interval Timer register for time measurement.
This value results in faster profiling runs, but in extremely rare circumstances, it can produce incorrect
data. This is the default value. If you ever suspect that the profile data generated using the quick
value is incorrect, rerun the quick command and verify whether the results can be replicated.
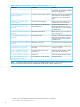
The thorough or strict value is the opposite of quick, and disables the use of the Interval Timer. The
profiling runs are longer, and provides timing data with the same (relatively poor) quality as the
system calls used to measure the time. The profiling intrusion and overhead also increases. This is
the default value.
Do not specify this option unless you know what you are doing. The collected profile data will
almost certainly have less accuracy than when collected using the quick value.
time_on=<integer>
Specifies the time in seconds between the application start and the time when the profile data
collection starts. If no time_on option is present, the data collection begins at the VM initialization.
time_on=sigusr1|sigusr2
Specifies which signal causes profiling to begin (profile data collection). Ensure that the application
or the VM may already be using the sigusr signals for their own purposes; see the documentation.
Specifying a signal and a timeout at the same time is possible by repeating the time_on option.
Only one of the two signals can be declared to use as the signal to start profiling. During the
application's run, the specified signal can be delivered to the Java process multiple times.
-Xeprof 19