
NonStop Development Environment for Eclipse Debugging Supplement

• The Registers view displays register values for the current program execution point. Selecting
a frame on the call stack does not cause the Registers view to display the registers for that
frame.
• Setting watchpoints is not supported. Instead, you can use the mab command, which has
similar capabilities, in the Native Inspect (einspect) console.
• A running program process cannot start the debugger. For example you cannot call the
debugger program from the process.
• Debugging snapshot files, the NonStop debugging equivalent to core files, is not supported.
For information about the CDT, see the C/C++ Development User Guide.
Debug Configurations dialog for NonStop debugging configurations
Before you can debug a remote NonStop application, you must create a debug configuration
using the Debug Configurations dialog.
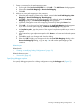
You can access this dialog in any of these ways:
• In the Project Explorer view, right-click and select Debug As→Debug Configurations...
• On the main menu bar, select Run→Debug Configurations...
• In the main tool bar, also known as the Workbench toolbar, select the Debug view menu icon
( ), then select Debug Configurations....
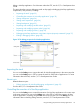
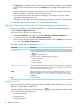
This dialog includes these components (see Figure 2):
DescriptionComponent
Lists the types of debug configurations available and allows you to add, duplicate,
or remove debug configurations. A NonStop debug configuration has the NonStop
icon as its label decoration.
These are the types of NonStop debug configurations:
• NonStop Application
• NonStop Attach
• NonStop Snapshot
Configurations list
Contains the name of the debug configuration and several tabs for specifying the
details of the debug configuration. This group box is displayed when you select
a debug configuration type to add or edit.
Debug configuration group box
Begins the debugging session. This button is disabled when there is an error in
the debug configuration. Errors are displayed in the upper left portion of the
dialog. For example, Figure 9 (page 26) shows an error and an error marker on
the Main tab.
Debug
Closes this dialog.Close
Configurations list
This list contains all the debug configurations that are available in this workspace. You can add,
duplicate, or delete debug configurations.
A NonStop debug configuration has the NonStop icon as its label decoration. These are the
types of NonStop debug configurations:
• NonStop Application
• NonStop Attach
• NonStop Snapshot
40 Reference Information