
Code Profiling Utilities Manual

Code Profiling Usage Scenarios
HP Code Profiling Utilities Manual—542684-003
9-7
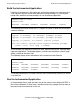
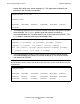
Run the Optimized Application
In this build step, note that the profuse compiler option is specified and the -l pgo linker
option is not specified. Since the profuse option does not specify a file path, the
compiler looks for the DPI file in the current subvolume. The contents of the subvolume
are the same as before, except that the output files from the compile and link steps
have been replaced by newer versions.
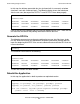
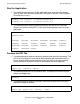
Run the Optimized Application
The optimized application that has just been built can be run using the same command
as, but it should show improved performance. The optimized application should be
thoroughly tested, as the use of different compiler options can uncover latent errors. In
particular, optimizations can expose timing-related errors.
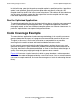
Code Coverage Example
The most obvious application of code coverage technology is for a quality assurance
group to determine what parts of a program were executed by some set of test runs.
The goal, in this case, is for the test suite to be as comprehensive as possible,
ensuring that the code has been well exercised before release to users.
In this scenario, one would typically rebuild the product, perform the test runs, and
generate the reports in quick succession, probably not retaining intermediate files for
very long, because the files become obsolete as soon as the source code changes. A
quality assurance group might go through this process once a month.
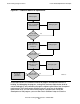
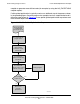
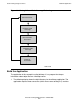
Figure 9-3 illustrates a typical scenario in which a group develops a software product,
establishes the code coverage provided by a set of test cases, runs an actual customer
use case or sample workload, and uses the coverage as a basis for enhancing the test
library.