
HP Insight Control for Linux 7.1 User Guide
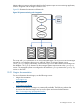
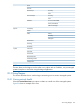
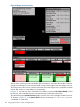
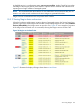
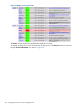
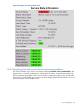
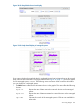
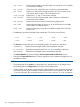

Figure 30 HP Graph default overview display
Figure 31 HP Graph detail display of managed systems
If you want to display the graphical data for a selected Nagios host (a Nagios host can be a virtual
host), select an item in the menu in the upper left-hand side. Figure 32 (page 171) shows the graphs
for one managed system, osmone. The following menus and menu items control the information
you can display for a managed system:
• The Metric menu influences the information shown in the graphs. This menu offers the following
choices:
bytes in Reports the rate of data received on network devices on the managed
system.
bytes out Reports the rate of data transmitted on network devices on the managed
system.
cpu idle Indicates how much of the managed system's CPU set was available for
other tasks.
20.3 Using Nagios 169