
HP Insight Control Virtual Machine Management 6.0

• Storage throughput—The storage read and written by this virtual machine. The utilization bar indicates
the virtual machine storage throughput as a percentage of the total storage throughput on the virtual
machine host .
• Storage read throughput—The storage read by this virtual machine. The utilization bar indicates the
virtual machine storage read throughput as a percentage of the total storage throughput on the virtual
machine host.
• Storage write throughput—The storage written by this virtual machine. The utilization bar indicates the
virtual machine storage write throughput as a percentage of the total storage throughput on the virtual
machine host.
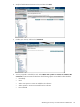
Resource allocation
The bars indicate the virtual machine allocation relative to the capacity available on the virtual machine
host.
NOTE: Resource allocation is not available for Citrix XenServer, or Xen on RHEL or SLES.
• VMware ESX Server virtual machines
CPU Min—The cpu.min value reported by VMware ESX•
• CPU Max—The cpu.max value reported by VMware ESX
• CPU Shares—The cpu.shares value reported by VMware ESX
• Microsoft Hyper-V server virtual machines
Reserved capacity—The reserved system capacity value reported by the virtual server relative to
1 CPU
•
• Maximum capacity—The maximum system capacity value reported by the virtual server relative
to 1 CPU
• Relative weight—The relative weight value reported by the virtual server
Threshold settings
Threshold of a virtual machine that can be evaluated. This will have information only if the threshold limit
has been set.
• State—The current state of this threshold. The state can be:
Unknown, indicating that the number of utilization samples available is less than the threshold
interval.
•
• Normal, indicating that sufficient utilization samples are available, and the measured value is less
than or equal to the threshold value
• Exceeded, indicating that sufficient utilization samples are available, and the measured value is
greater than the threshold value
• Threshold settings—Threshold of a virtual machine that can be evaluated
• Threshold value—The maximum utilization value that provides a normal status
• Measured interval—The number of minutes of utilization data that was averaged when calculating the
measured value
• Measured value—The average utilization over the most recently measured interval (in minutes)
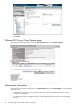
Performance color codes
The color codes on the Performance page indicate the percentage of a resource that has been consumed.
The colors of the utilization bar indicate the following conditions:
• Blue—Indicates throughput.
• Green—Indicates utilization is less than 70%.
Resource allocation 49