
HP Insight Control Power Management 7.0 User Guide
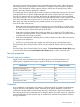
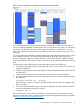
The line graphs show that the power saved by HP Dynamic Power Savings Mode increases as the
workload approaches 80% utilization. If the system is configured for HP Static Low Power Mode,
it continues to save increasing amounts of power up to 100% utilization.
The wider the gap between the red line and the blue or green line, the more power is saved.
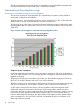
Analysis of throughput
In the above figure, 1.00 throughput represents the maximum work that can be accomplished by
a system regardless of the Power Regulator mode. All other throughputs are relative to this 1.00
value.
The red bar shows the normalized throughput (or work accomplished) in HP Static High Performance
Mode. In this mode, the relative throughput ranges from no throughput in an idle state up to 1.00
at 100% utilization. This is an example of the relative throughput without Power Regulator
technology.
The green bar shows the normalized throughput in HP Static Low Power Mode. In this mode, the
throughput ranges from no throughput in an idle state to 0.79 at 80% utilization, and to 0.93 at
100% utilization.
The blue bar shows the normalized throughput in HP Dynamic Power Savings Mode. In this mode,
the throughput ranges from no throughput in an idle state to 0.79 at 80% utilization, and to 1.00
at 100% utilization.
The normalized throughput for all three Power Regulator modes is identical up to an 80% workload.
This indicates that the workload can be completed at either the higher processor p-state (HP Static
High Performance Mode) or the lower processor p-state (HP Static Low Power Mode/HP Dynamic
Power Savings Mode). At a 90% to 100% workload, the HP Static Low Power Mode has insufficient
CPU cycles at the lower processor p-state to complete the workload that can be accomplished at
the higher p-state.
Conclusion
The previous figure illustrates:
1. HP Static Low Power Mode and HP Dynamic Power Savings Mode save resources when
compared to no power management or HP Static High Performance Mode.
2. HP Static Low Power Mode saves the most resources at full utilization, but still can have some
impact on system performance at the highest levels of utilization.
3. HP Dynamic Power Savings Mode saves the most resources at the workload level just before
it switches to the higher processor p-state.
4. HP Dynamic Power Savings Mode delivers exactly the same level of performance as no power
management or HP Static High Performance Mode.
5. Power Regulator technology saves resources on systems that are busy rather than those that
are idle.
Reducing cooling power with Power Regulator
Power consumed by the system becomes heat that must be extracted by the data center. The
previous figure illustrates that each watt consumed by the system requires another 1.0 to 1.5 watts
for the environmental control system to cool the system. Correspondingly, reducing power
consumption by the system reduces the air conditioning requirements for the system.
Insight Control power management Power Consumption and CPU Performance graphs estimate
the cooling costs saved.
Avoiding data center expansion
Data center expansion/construction costs an average of $22,000 per square foot. Insight Control
power management can help you determine accurately or set the upper limit for device power
consumption to include more systems in the same rack. Using Insight Control power management
Power Regulator 15