
HP Insight Control for Linux 7.0 User Guide
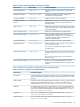
• User Time
• System Time
• Nice Time
• Idle Time
• Load Averages (1-Minute, 5-Minute, And 15-Minute Intervals)
• Total Processes
• Total User Processes
• Total Zombie Processes
• Network Received MB
• Network Received Packets
• Network Received Dropped Packets
• Network Received Errors
• Network Transmitted MB
• Network Transmitted Packets
• Network Transmitted Dropped Packets
• Network Transmitted Errors
• Total Swap
• Swap In Use
• Pages In
• Pages Out
• Pages Swapped In
• Pages Swapped Out
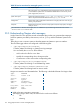
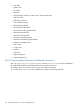
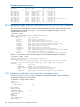
20.8.8 Customizing the Performance Dashboard tool metrics
The /opt/hptc/cmu/etc/sysconfig/ActionAndAlertsFile.txt file on the CMS defines
the metrics that the Performance Dashboard tool can monitor and report.
To modify a metric or to create a new one, use a text editor to open the
ActionAndAlertsFile.txt file, and follow the instructions at the top of the file.
178 Using graphical tools to monitor managed systems