
HP Insight Control for Linux 7.0 User Guide
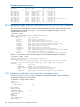

Table 21 Nagios monitoring plug-ins running on the CMS
Function/DescriptionPlug-in nameService name
Monitors the Web server providing the Nagios Web
interface.
check_httpApache HTTPS Server
Periodically generates and updates configuration
information for managed systems.
check_node_configConfiguration Monitor
Watches the DHCP service on the CMS.check_procsIP Assignment DHCP
Watches the /opt/hptc/etc/sysconfig/vars.ini
file and reports if the file is not synchronized across
managed systems.
check_nagios_varsManagement Settings
Monitor
Watches the Nagios master and Nagios monitor systems
on the CMS and reports on the status of the Nagios master
and monitor daemons.
check_nrpeNagios Monitor
Gathers environmental data for managed systems.check_metricsSensor Collection Monitor
Gathers (predetermined) Supermon metrics for the
managed systems. It collects loadave, environmental,
check_metricsSupermon Metrics Monitor
and system information data and stores it in the
round-robin database (RRD).
Gathers switch status and metrics through SNMP.switch_pollerSwitch Data Collection
Watches for patterns in the /opt/hptc/nagios/etc/
syslogAlertRules file.
check_syslogalertsSyslog Alert Monitor
The Syslog Alerts Nagios service reports individual
per-system results.
Monitors the hardware event log and issues alerts based
on patterns in the /opt/hptc/nagios/etc/selRules
file.
check_selmonSystem Event Log Monitor
The Syslog Alerts Nagios service reports individual
per-system results.
Gathers sensor data for HP BladeSystem Enclosures.check_enclosuresEnclosure Collection Monitor
Enclosures are represented as hosts in the Nagios web
interface.
Table 22 lists the services that are monitored on every managed system.
Table 22 Services monitored on managed systems
Function/DescriptionService name
Provides per-system sensor reporting and alerts. It reports on an individual managed
system's sensor status. Depending on the system type, all available live sensors are
reported.
Environment
1
Provides per-system load average information and alerts. It reports a single managed
system's most recently collected load average. Alerts are generated based on
thresholds defined in the /opt/hptc/nagios/etc/nagios_vars.ini file.
Load Average
2
Provides per-system process, user, and disk statistics. It reports and alerts based on
an individual managed system's process counts, total, user, zombie processes, and
NodeInfo
2
system uptime. Alerts are generated based on thresholds defined in the /opt/hptc/
nagios/etc/nagios_vars.ini file.
Links to any consolidated log messages that match patterns in the /opt/hptc/
nagios/etc/syslogAlertRules file.
Syslog Alerts
1
Links to any System Event Log messages that match patterns in the /opt/hptc/
nagios/etc/selRules file.
System Event Log
1
20.4 Services monitored by Nagios 171