
Extending ICE-Linux Monitoring
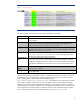

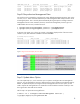
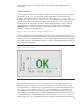

Figure 1. Typical Nagios Display
The specific services from the above screen capture are defined in this table:
Servi
ce Description
Environment
Per-node temperature, fan, power supply, and other sensor information supplied
by the platform.
Load Average
Per-node the load averages. Load averages are displayed for the 1, 5, and 15
minute intervals. Values are compared to per-node thresholds defined in the
/opt/hptc/nagios/etc/nagios_vars.ini file.
Nodeinfo
Per-node process and user information. Total processes, user (non-system)
processes, and zombies, as well as user counts are compared against thresholds
defined in the nagios_vars.ini file.
Syslog Alerts
Per-node alerts that match patterns found in the
/opt/hptc/nagios/etc/syslogAlertRules file. Clicking a hyper-link in
the status text displays previously found patterns.
System Event
log
Per-node alerts that match patterns found in the
/opt/hptc/nagios/etc/selRules file. The System Event Log is collected
through the management processor, either an iLO or an IPMI BMC. System Events
are hardware-related alerts such as memory errors, power supply faults, and so
on.
System Free
Space
Per-node free space status. This is compared to thresholds defined in the
nagios_vars.ini file.
Configuration
Per-node configuration information and quick reference for the ICE-Linux assigned
simple node name.
ICE-Linux gathers data using the platform specific management processor, iLO or IPMI, as well as OS
provided metrics such as load average, nodeinfo, system free space and so on. Other information
such as syslog alerts is obtained from the consolidated log file,
/hptc_cluster/adm/logs/consolidated.log . The shaded rows in the table above indicate
services that use mond to collect their data. This information is stored in a Round Robin Database
(RRD) for future reference and to enable graphical displays. All non-shaded information is collected
without agents and is therefore available for any host being monitored by ICE-Linux. In addition to the
metrics displayed and tracked by Nagios, additional metrics are also captured and stored in RRDs.
You can find (and customize) the list of captured metrics in the nagios_vars.ini file.
3