
HP Insight Cluster Management Utility v7.2 User Guide
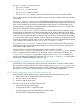
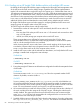
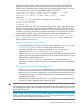

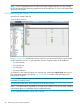
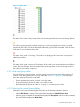
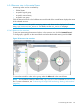
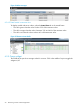
Table Of Contents
- HP Insight Cluster Management Utility v7.2
- Contents
- 1 Overview
- 2 Installing and upgrading HP Insight CMU
- 2.1 Installing HP Insight CMU
- 2.1.1 Management node hardware requirements
- 2.1.2 Disk space requirements
- 2.1.3 Support for non-HP servers
- 2.1.4 Planning for compute node installation
- 2.1.5 Firmware upgrade requirements
- 2.1.6 Configuring the local smart array card
- 2.1.7 Configuring the management cards
- 2.1.8 Configuring the BIOS
- 2.2 Preparing for installation
- 2.3 Installation procedures
- 2.4 Installing HP Insight CMU with high availability
- 2.5 Upgrading HP Insight CMU
- 2.5.1 Upgrading to v7.2 important information
- 2.5.2 Dependencies
- 2.5.3 Stopping the HP Insight CMU service
- 2.5.4 Upgrading Java Runtime Environment
- 2.5.5 Removing the previous HP Insight CMU package
- 2.5.6 Installing the HP Insight CMU v7.2 package
- 2.5.7 Installing your HP Insight CMU license
- 2.5.8 Restoring the previous HP Insight CMU configuration
- 2.5.9 Configuring the updated UP Insight CMU
- 2.5.10 Starting HP Insight CMU
- 2.5.11 Deploying the monitoring client
- 2.6 Saving the HP Insight CMU database
- 2.7 Restoring the HP Insight CMU database
- 2.1 Installing HP Insight CMU
- 3 Launching the HP Insight CMU GUI
- 4 Defining a cluster with HP Insight CMU
- 5 Provisioning a cluster with HP Insight CMU
- 5.1 Logical group management
- 5.2 Autoinstall
- 5.3 Backing up
- 5.4 Cloning
- 5.5 Node static info
- 5.6 Rescan MAC
- 5.7 HP Insight CMU image editor
- 5.8 HP Insight CMU diskless environments
- 5.8.1 Overview
- 5.8.2 The system-config-netboot diskless method
- 5.8.2.1 Operating systems supported
- 5.8.2.2 Installing the operating system on the management node and the golden node
- 5.8.2.3 Modifying the TFTP server configuration
- 5.8.2.4 Populating the HP Insight CMU database
- 5.8.2.5 Creating a diskless image
- 5.8.2.6 Creating a diskless logical group
- 5.8.2.7 Adding nodes into the logical group
- 5.8.2.8 Booting the compute nodes
- 5.8.2.9 Understanding the structure of a diskless image
- 5.8.2.10 Customizing your diskless image
- 5.8.2.11 Best practices for diskless clusters
- 5.8.3 The HP Insight CMU oneSIS diskless method
- 5.8.3.1 Operating systems supported
- 5.8.3.2 Enabling oneSIS support
- 5.8.3.3 Preparing the HP Insight CMU management node
- 5.8.3.4 Preparing the golden node
- 5.8.3.5 Capturing and customizing a oneSIS diskless image
- 5.8.3.6 Manage the writeable memory usage by the oneSIS diskless clients
- 5.8.3.7 Adding nodes and booting the diskless compute nodes
- 5.8.4 Scaling out an HP Insight CMU diskless solution with multiple NFS servers
- 6 Monitoring a cluster with HP Insight CMU
- 6.1 Installing the HP Insight CMU monitoring client
- 6.2 Deploying the monitoring client
- 6.3 Monitoring the cluster
- 6.4 Stopping HP Insight CMU monitoring
- 6.5 Customizing HP Insight CMU monitoring, alerting, and reactions
- 6.5.1 Action and alert files
- 6.5.2 Actions
- 6.5.3 Alerts
- 6.5.4 Alert reactions
- 6.5.5 Modifying the sensors, alerts, and alert reactions monitored by HP Insight CMU
- 6.5.6 Using collectl for gathering monitoring data
- 6.5.7 Monitoring GPUs and coprocessors
- 6.5.8 Monitoring HP Insight CMU alerts in HP Systems Insight Manager
- 6.5.9 Extended metric support
- 7 Managing a cluster with HP Insight CMU
- 7.1 Unprivileged user menu
- 7.2 Administrator menu
- 7.3 SSH connection
- 7.4 Management card connection
- 7.5 Virtual serial port connection
- 7.6 Shutdown
- 7.7 Power off
- 7.8 Boot
- 7.9 Reboot
- 7.10 Change UID LED status
- 7.11 Multiple windows broadcast
- 7.12 Single window pdsh
- 7.13 Parallel distributed copy (pdcp)
- 7.14 User group management
- 7.15 HP Insight firmware management
- 7.16 Customizing the GUI menu
- 7.17 HP Insight CMU CLI
- 8 Advanced topics
- 9 Support and other resources
- A Troubleshooting
- HP Insight CMU manpages
- cmu_boot(8)
- cmu_show_nodes(8)
- cmu_show_logical_groups(8)
- cmu_show_network_entities(8)
- cmu_show_user_groups(8)
- cmu_show_archived_user_groups(8)
- cmu_add_node(8)
- cmu_add_network_entity(8)
- cmu_add_logical_group(8)
- cmu_add_to_logical_group_candidates(8)
- cmu_add_user_group(8)
- cmu_add_to_user_group(8)
- cmu_change_active_logical_group(8)
- cmu_change_network_entity(8)
- cmu_del_from_logical_group_candidates(8)
- cmu_del_from_network_entity(8)
- cmu_del_archived_user_groups(8)
- cmu_del_from_user_group(8)
- cmu_del_logical_group(8)
- cmu_del_network_entity(8)
- cmu_del_node(8)
- cmu_del_snapshots(8)
- cmu_del_user_group(8)
- cmu_console(8)
- cmu_power(8)
- cmu_custom_run(8)
- cmu_clone(8)
- cmu_backup(8)
- cmu_scan_macs(8)
- cmu_rescan_mac(8)
- cmu_mod_node(8)
- cmu_monstat(8)
- cmu_image_open(8)
- cmu_image_commit(8)
- cmu_config_nvidia(8)
- cmu_config_amd(8)
- cmu_config_intel(8)
- cmu_mgt_config(8)
- cmu_firmware_mgmt(8)
- cmu_monitoring_dump(8)
- cmu_rename_archived_user_group(8)
- Glossary
- Index
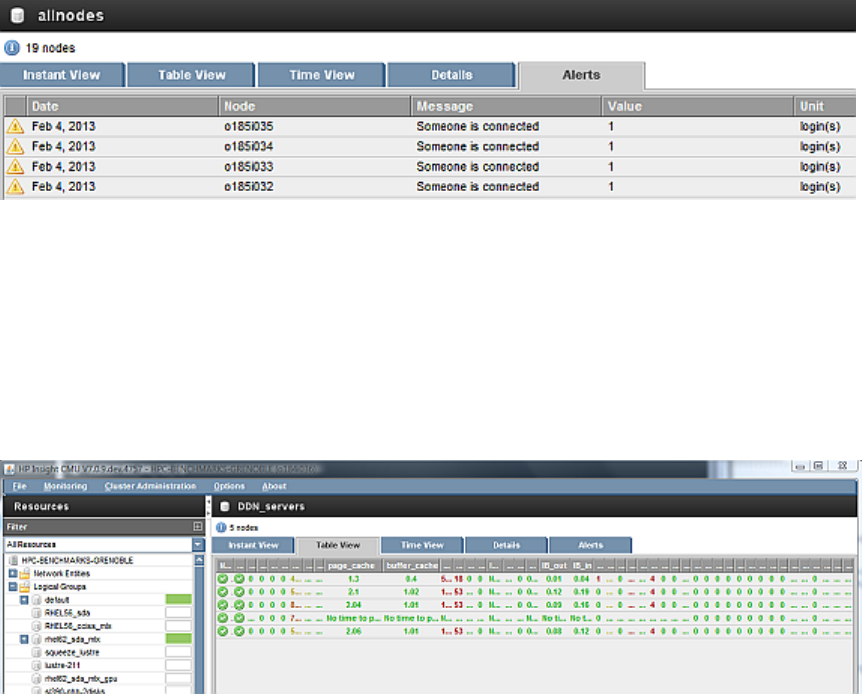
Figure 34 Alert messages
6.3.4.2 Detail mode in resource view
To display a table with sensor values, select the Instant View tab in the central frame.
• The cell is green when the value is below 33% of the maximum value.
• The cell is orange when the value is between 33% and 66% of the maximum value.
• The cell is red when the value is above 66% of the maximum value.
Figure 35 Resource view details
6.3.5 Gauge widget
The middle of the pie shows average values for a sensor. Click in the middle of a pie to toggle the
widget on/off.
90 Monitoring a cluster with HP Insight CMU