
HP Insight Cluster Management Utility v7.2 User Guide
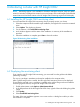
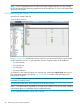
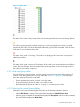
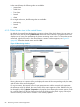
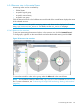
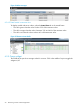
Table Of Contents
- HP Insight Cluster Management Utility v7.2
- Contents
- 1 Overview
- 2 Installing and upgrading HP Insight CMU
- 2.1 Installing HP Insight CMU
- 2.1.1 Management node hardware requirements
- 2.1.2 Disk space requirements
- 2.1.3 Support for non-HP servers
- 2.1.4 Planning for compute node installation
- 2.1.5 Firmware upgrade requirements
- 2.1.6 Configuring the local smart array card
- 2.1.7 Configuring the management cards
- 2.1.8 Configuring the BIOS
- 2.2 Preparing for installation
- 2.3 Installation procedures
- 2.4 Installing HP Insight CMU with high availability
- 2.5 Upgrading HP Insight CMU
- 2.5.1 Upgrading to v7.2 important information
- 2.5.2 Dependencies
- 2.5.3 Stopping the HP Insight CMU service
- 2.5.4 Upgrading Java Runtime Environment
- 2.5.5 Removing the previous HP Insight CMU package
- 2.5.6 Installing the HP Insight CMU v7.2 package
- 2.5.7 Installing your HP Insight CMU license
- 2.5.8 Restoring the previous HP Insight CMU configuration
- 2.5.9 Configuring the updated UP Insight CMU
- 2.5.10 Starting HP Insight CMU
- 2.5.11 Deploying the monitoring client
- 2.6 Saving the HP Insight CMU database
- 2.7 Restoring the HP Insight CMU database
- 2.1 Installing HP Insight CMU
- 3 Launching the HP Insight CMU GUI
- 4 Defining a cluster with HP Insight CMU
- 5 Provisioning a cluster with HP Insight CMU
- 5.1 Logical group management
- 5.2 Autoinstall
- 5.3 Backing up
- 5.4 Cloning
- 5.5 Node static info
- 5.6 Rescan MAC
- 5.7 HP Insight CMU image editor
- 5.8 HP Insight CMU diskless environments
- 5.8.1 Overview
- 5.8.2 The system-config-netboot diskless method
- 5.8.2.1 Operating systems supported
- 5.8.2.2 Installing the operating system on the management node and the golden node
- 5.8.2.3 Modifying the TFTP server configuration
- 5.8.2.4 Populating the HP Insight CMU database
- 5.8.2.5 Creating a diskless image
- 5.8.2.6 Creating a diskless logical group
- 5.8.2.7 Adding nodes into the logical group
- 5.8.2.8 Booting the compute nodes
- 5.8.2.9 Understanding the structure of a diskless image
- 5.8.2.10 Customizing your diskless image
- 5.8.2.11 Best practices for diskless clusters
- 5.8.3 The HP Insight CMU oneSIS diskless method
- 5.8.3.1 Operating systems supported
- 5.8.3.2 Enabling oneSIS support
- 5.8.3.3 Preparing the HP Insight CMU management node
- 5.8.3.4 Preparing the golden node
- 5.8.3.5 Capturing and customizing a oneSIS diskless image
- 5.8.3.6 Manage the writeable memory usage by the oneSIS diskless clients
- 5.8.3.7 Adding nodes and booting the diskless compute nodes
- 5.8.4 Scaling out an HP Insight CMU diskless solution with multiple NFS servers
- 6 Monitoring a cluster with HP Insight CMU
- 6.1 Installing the HP Insight CMU monitoring client
- 6.2 Deploying the monitoring client
- 6.3 Monitoring the cluster
- 6.4 Stopping HP Insight CMU monitoring
- 6.5 Customizing HP Insight CMU monitoring, alerting, and reactions
- 6.5.1 Action and alert files
- 6.5.2 Actions
- 6.5.3 Alerts
- 6.5.4 Alert reactions
- 6.5.5 Modifying the sensors, alerts, and alert reactions monitored by HP Insight CMU
- 6.5.6 Using collectl for gathering monitoring data
- 6.5.7 Monitoring GPUs and coprocessors
- 6.5.8 Monitoring HP Insight CMU alerts in HP Systems Insight Manager
- 6.5.9 Extended metric support
- 7 Managing a cluster with HP Insight CMU
- 7.1 Unprivileged user menu
- 7.2 Administrator menu
- 7.3 SSH connection
- 7.4 Management card connection
- 7.5 Virtual serial port connection
- 7.6 Shutdown
- 7.7 Power off
- 7.8 Boot
- 7.9 Reboot
- 7.10 Change UID LED status
- 7.11 Multiple windows broadcast
- 7.12 Single window pdsh
- 7.13 Parallel distributed copy (pdcp)
- 7.14 User group management
- 7.15 HP Insight firmware management
- 7.16 Customizing the GUI menu
- 7.17 HP Insight CMU CLI
- 8 Advanced topics
- 9 Support and other resources
- A Troubleshooting
- HP Insight CMU manpages
- cmu_boot(8)
- cmu_show_nodes(8)
- cmu_show_logical_groups(8)
- cmu_show_network_entities(8)
- cmu_show_user_groups(8)
- cmu_show_archived_user_groups(8)
- cmu_add_node(8)
- cmu_add_network_entity(8)
- cmu_add_logical_group(8)
- cmu_add_to_logical_group_candidates(8)
- cmu_add_user_group(8)
- cmu_add_to_user_group(8)
- cmu_change_active_logical_group(8)
- cmu_change_network_entity(8)
- cmu_del_from_logical_group_candidates(8)
- cmu_del_from_network_entity(8)
- cmu_del_archived_user_groups(8)
- cmu_del_from_user_group(8)
- cmu_del_logical_group(8)
- cmu_del_network_entity(8)
- cmu_del_node(8)
- cmu_del_snapshots(8)
- cmu_del_user_group(8)
- cmu_console(8)
- cmu_power(8)
- cmu_custom_run(8)
- cmu_clone(8)
- cmu_backup(8)
- cmu_scan_macs(8)
- cmu_rescan_mac(8)
- cmu_mod_node(8)
- cmu_monstat(8)
- cmu_image_open(8)
- cmu_image_commit(8)
- cmu_config_nvidia(8)
- cmu_config_amd(8)
- cmu_config_intel(8)
- cmu_mgt_config(8)
- cmu_firmware_mgmt(8)
- cmu_monitoring_dump(8)
- cmu_rename_archived_user_group(8)
- Glossary
- Index
In the central frame, the following tabs are available:
• Instant View
• Table View
• Time View
• Details
• Alerts
For a single node view, the following tabs are available:
• Monitoring
• Details
• Alerts
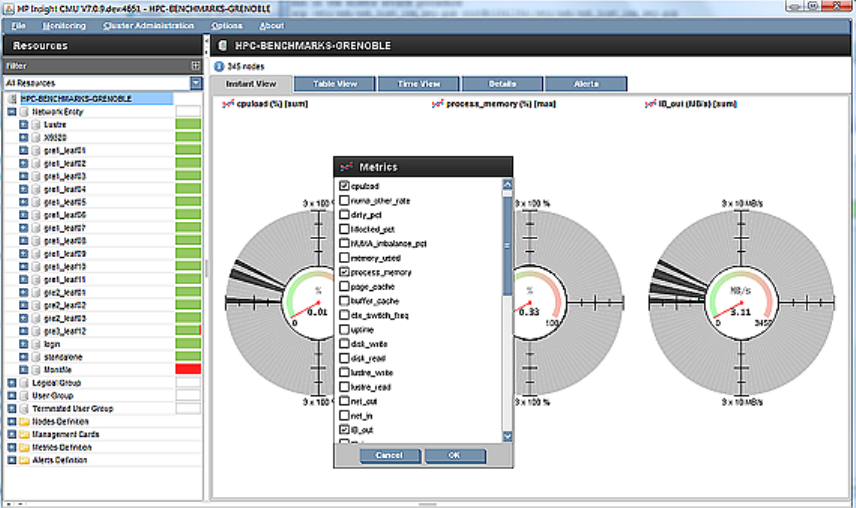
6.3.3 Global cluster view in the central frame
By default, the central frame displays the monitoring values of the whole cluster. You can return to
this view at any time by clicking CMU Cluster at the root of the node tree. The global cluster view
displays one or more pies representing the cluster monitoring sensor value. To choose the sensors
monitored, right-click an item in the central frame. A metrics window appears, see Figure 32
(page 88). Select the desired metric and click OK.
Figure 32 Monitoring window
Pausing the mouse on a portion of the pie displays the name of the corresponding node, the status,
and the value of the sensor displayed.
For a given metric, the internal circle of a pie represents zero and the external circle represents
the maximum value. By default, the current value of the metric appears in blue. Default color can
be changed by clicking Option→Properties in the top bar, then selecting the monitor options. Color
for a specific petal can also be changed on the fly by clicking on the petal. A grey colored pie
means no activity on the node or a metric is not correctly updated.
88 Monitoring a cluster with HP Insight CMU