
Using High Availability Monitors (June 2007)

Monitoring Database Resources
Database Monitor Reference
Chapter 368
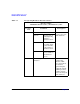
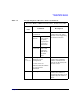
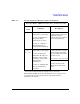
read_
cache_
hit_rate
a floating-point number,
expressed as a percentage
a value of 100 would
imply that all reads are
from the cache; in other
words, the closer to 100,
the better the
performance
a value of -1 implies that
no logical reads have
occurred
This resource class
describes the ratio of logical
reads less physical reads to
logical reads, done by the
database server:
this is a measure of the
effectiveness of the read
cache.
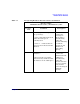
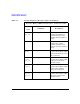
started character numbers in the
following format (year,
month, day, hour, minute,
and second):
YYYY/MM/DD HH:MM:SS.S
This resource class
describes date and time
when the database server
was last started.
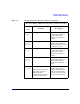
uptime a floating-point value in
seconds
a value of minus one (-1)
might indicate that the
database server started
before the SNMP
subagent
This resource class
describes length of time the
database server has been
running.
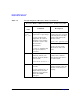
Table 3-2 Interpreting Server Resource Classes (Continued)
Resource Name: /rdbms/server/resource_class/server_name
resource
_
class
Condition Description
(logical_reads) - (physical_reads)
(logical_reads)