Using High Availability Monitors Manufacturing Part Number : B5736-90074 June 2007 © Copyright 1997, 2003, 2007 Hewlett-Packard Development Company, L.P.
Legal Notices Confidential computer software. Valid license from HP required for possession, use or copying. Consistent with FAR 12.211 and 12.212, Commercial Computer Software, Computer Software Documentation, and Technical Data for Commercial Items are licensed to the U.S. Government under vendor's standard commercial license. The information contained in this document is subject to change without notice.
Contents 1. Understanding the Event Monitoring Service Event Monitoring Service Overview . . . . . . . . . . . . . . . . . . . . . . . . . . . . . . . . . . . . . . . . EMS Requirements . . . . . . . . . . . . . . . . . . . . . . . . . . . . . . . . . . . . . . . . . . . . . . . . . . . . . EMS Resource Classes. . . . . . . . . . . . . . . . . . . . . . . . . . . . . . . . . . . . . . . . . . . . . . . . . . . Client and Target Applications . . . . . . . . . . . . . . . . . . . . . . . . . . . . . . . . . .
Contents 3. Monitoring Database Resources Database Monitor Reference . . . . . . . . . . . . . . . . . . . . . . . . . . . . . . . . . . . . . . . . . . . . . . Database Resources . . . . . . . . . . . . . . . . . . . . . . . . . . . . . . . . . . . . . . . . . . . . . . . . . . . Server Resources. . . . . . . . . . . . . . . . . . . . . . . . . . . . . . . . . . . . . . . . . . . . . . . . . . . . . . Rules for Using the HA Database Monitor with ServiceGuard. . . . . . . . . . . . . . . . . . .
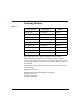
Printing History Table 1 Printing Date Part Number Edition August 1997 B5735-90001 Edition 1 October 1998 B5736-90006 Edition 2 March 1999 B5736-90012 Edition 3 May 1999 B5736-90018 Edition 4 August 1999 B5736-90022 Edition 5 November 1999 B5736-90025 Edition 6 June 2003 B5736-90046 Edition 7 February 2007 B5736-90070 Edition 8 June 2007 B5736-90074 Edition 9 This edition documents configuring High Availability Monitors. The printing date changes when a new edition is printed.
Preface This guide describes how to install and configure the High Availability Monitors to monitor system health. The chapters are as follows: • “Understanding the Event Monitoring Service,” which describes the Event Monitoring Service components and operations, including the role of High Availability Monitors. • “Monitoring Disk Resources,” which provides guidelines on using the disk monitor, including using it with MC/ServiceGuard or ServiceGuard OPS Edition.
• Tom Madell, Disk and File Management Tasks on HP-UX (ISBN 0-13-518861-X). HP Press; Prentice Hall, Inc., 1997. • Managing Systems and Workgroups (HP Part Number B2355-90664) • HP OpenView IT/Operations Admnistrator’s Reference (HP Part Number B6941-90001) • Managing Highly Available NFS (HP Part Number B5125-90001) • http://docs.hp.
Understanding the Event Monitoring Service 1 Understanding the Event Monitoring Service This document, Using High Availability Monitors, describes how to configure high availability monitors. The chapters in this book are specific to each HA Monitor and describe the options, settings, and provide suggestions for configuring your HA Monitor. HA Monitors is part of a total Event Monitoring Service. This chapter describes the components of the Event Monitoring Service.
Understanding the Event Monitoring Service Event Monitoring Service Overview Event Monitoring Service Overview The Event Monitoring Service (EMS) monitors system resources. EMS is used by system administrators to configure monitoring requests, check resource status, and send notification when configured conditions are met. EMS can work in a high availability environment. It can report a loss of redundant resources.
Understanding the Event Monitoring Service Event Monitoring Service Overview — email This option does not require any extra handling. Specify the email address when the monitoring request is created. — syslog and textlog This option does not require any extra handling. Specify the log file when the monitoring request is created. Syslog notifications go to the local system. — console This option does not require any extra handling. Specify the console when the monitoring request is created.
Understanding the Event Monitoring Service Event Monitoring Service Overview Developers use the API to create additional monitors for use with client and target applications, such as the EMS GUI, EMS CLI or ServiceGuard. Monitor components to be created include: resource dictionary, resource monitor binary file, manpage (recommended), and message catalog (recommended). Figure 1-1 shows the relationships between the Event Monitoring Service components.
Understanding the Event Monitoring Service Event Monitoring Service Overview • monconfig utility • resls or resdata commands 2. The EMS API provides the interface between the client request and the registrar. There is a one to one correspondence between the client and registrar. 3. The registrar refers to the dictionary for a list of available resources and related monitors. The resources listed in the dictionary are passed back to the client. 4.
Understanding the Event Monitoring Service Event Monitoring Service Overview 8. The registrar passes completed monitoring requests down to the appropriate resource monitor application. 9. The monitor checks the resource as specified in the monitor request. It passes back to the EMS API whether the request is accepted or rejected. 10. The EMS API provides the interface between the monitor and the target. 11. The monitor begins collecting data as specified in the monitoring request. 12.
Understanding the Event Monitoring Service EMS Requirements EMS Requirements The following are system requirements for the Event Monitoring Service: • All hardware you intend to monitor, such as disks and LAN cards, have been configured and tested prior to configuring EMS. • EMS must be installed on an HP 9000 Series 700 or Series 800 system running HP-UX version 10.20 or later. When installing one or more EMS components, check that the version levels for the other components are compatible.
Understanding the Event Monitoring Service EMS Resource Classes EMS Resource Classes EMS groups resources into classes in a hierarchy similar to that of a file system structure. Figure 1-2 is a example of a resource hierarchy.
Understanding the Event Monitoring Service Client and Target Applications Client and Target Applications This section describes some of the client and target application options and processes. Target applications can be written using the EMS API. EMS with ServiceGuard ServiceGuard can be configured with EMS to monitor the health of selected resources, such as disks. Based on the status of the resources, ServiceGuard can decide to fail packages over.
Understanding the Event Monitoring Service Client and Target Applications The full path of a resource includes the resource class hierarchy and instance. An example of a full resource path for the physical volume status of the device /dev/dsk/c0t1d2 belonging to volume group vgDataBase, is /vg/vgDataBase/pv_pvlink/status/c0t1d2. 2. Specify when to collect the value. Select either and/or all: • When value is ... If you are setting up a request for an asynchronous monitor, this is the only option available.
Understanding the Event Monitoring Service Client and Target Applications • email • console syslog • textlog • wbem EMS CLI Client Application emscli is a command line utility that is used to configure and manage persistent monitoring requests for Event Monitoring Service (EMS) monitors, such as, HA Monitors, Hardware Monitors and Kernel Monitors. The emscli utility can be used to add, modify, delete, list and view monitoring requests and resources.
Understanding the Event Monitoring Service Client and Target Applications 3. Select Templates.
Understanding the Event Monitoring Service Resource Monitors Resource Monitors Resource monitors are applications written to gather and report information about specific resources on the system. The resource monitor: • Provides a list of resources that can be monitored • Provides information about the resources • Monitors the resources it supports • Provides values to the EMS API notification The EMS framework evaluates the data to determine if an event has occurred.
Understanding the Event Monitoring Service Resource Monitors Writing Resource Monitors The EMS API provides a method for writing new resource monitors. To create your own monitor, read the Writing Monitors for the Event Monitoring Service (EMS) (HP Part Number B7611-90016) manual and install the developer’s kit. Both are available at the following Website: 1. Go to the Website: http://www.software.hp.com 2.
Understanding the Event Monitoring Service EMS Framework Components EMS Framework Components This section describes the EMS framework components. The EMS API The EMS API is the interface between the registrar, client applications, target applications, and resource monitors as illustrated in Figure 1-1. The EMS API is provided as part of the EMS product.
Understanding the Event Monitoring Service EMS Framework Components The registrar does not need to keep any state information and does not need to be highly available. It does not need to be running while a resource is being monitored. The registrar is needed only to start the monitors and to provide communication between clients and monitors. One registrar process is started each time a client application calls rm_client_connect(), so a registrar is always connected to one client.
Understanding the Event Monitoring Service EMS Framework Components When the registrar needs to pass the request to a resource monitor, it needs to determine if the resource monitor is currently running. If the appropriate resource monitor process is not found, the registrar starts the process and waits until the resource monitor can communicate with the registrar. The Resource Dictionary The resource dictionary is the mechanism by which the resource monitor identifies itself to EMS.
Understanding the Event Monitoring Service EMS Framework Components 26 Chapter 1
Monitoring Disk Resources 2 Monitoring Disk Resources This chapter recommends ways to configure requests to the HA Disk Monitor for most high-availability configurations.
Monitoring Disk Resources HA Disk Monitor Reference HA Disk Monitor Reference The HA Disk Monitor reports information about the physical and logical volumes configured by LVM (Logical Volume Manager). Anything not configured through LVM cannot be monitored from the HA Disk Monitor.
Monitoring Disk Resources HA Disk Monitor Reference Figure 2-1 shows the class hierarchy for the HA Disk Monitor. Figure 2-1 Disk Monitor Resource Class Hierarchy Bold items are resource instances that can be monitored. Bold italic variables represent specific instances of volume groups, devices, and logical volumes on the system. Physical Volume Summary The pv_summary is the summary status of all physical volumes in a volume group.
Monitoring Disk Resources HA Disk Monitor Reference Table 2-1 lists how conditions compare in logical operations. Specify the logical operation in the monitor request parameters portion of the monitor request. For example, to create a request that alerts you when the condition is SUSPECT or DOWN, specify greater than or equal to 3 (>=3).
Monitoring Disk Resources HA Disk Monitor Reference diskmond[5699]: pv_summary will be unavailable for /dev/vg00 because there are physical volumes in this volume group which are on an unrecognized bus. (DRM-502). • PVGs (physical volume groups) exist in a volume group, but not all physical volumes are assigned to a PVG. The /var/adm/syslog/ syslog.
Monitoring Disk Resources HA Disk Monitor Reference The pv_pvlink status is used to calculate pv_summary. Although it is somewhat redundant to use both, you might want to have more specific status sent by pv_summary, and only have status sent on pv_pvlinks if a device is DOWN. pv_pvlinks and pv_summary supplement lv_summary by giving status on the accessibility of volume groups (both active and inactive) and logical volumes.
Monitoring Disk Resources HA Disk Monitor Reference Logical Volume Summary The logical volume summary describes how accessible the data is in all logical volumes in an active volume group. Sometimes the physical connection may be working, but the application cannot read or write data on the disk. The HA Disk Monitor determines I/O activity by querying LVM, and marks a logical volume as DOWN if a portion of its data is unavailable.
Monitoring Disk Resources HA Disk Monitor Reference Table 2-3 Interpreting Logical Volume Summary (Continued) Resource Name: /vg/vgName/lv_summary 34 Condition Value INACTIVE 2 Interpretation The volume group is inactive. This could be because: • The volume group is active in exclusive mode on another node in an ServiceGuard cluster. (This is not valid for clusters running ServiceGuard Extension for RAC, because it can support a volume group being active on more than one node.
Monitoring Disk Resources HA Disk Monitor Reference Logical Volume Status Logical volume status gives you status on each logical volume in a volume group. While the lv_summary gives you information on whether data in a volume group is available, the lv/status/lvName gives you information on whether specific logical volumes have failed. Table 2-4 lists how conditions compare in logical operations. You specify the logical operation in the monitor request parameters portion of the monitor request.
Monitoring Disk Resources HA Disk Monitor Reference When you first configure mirroring in LVM, it lists 0 mirrors, meaning you have only the original copy of the data. Likewise, 2 mirrors mean you have one original plus 2 mirrored copies.
Monitoring Disk Resources Rules for Using the HA Disk Monitor with ServiceGuard Rules for Using the HA Disk Monitor with ServiceGuard The HA Disk Monitor is designed for use with ServiceGuard to trigger package failover if host adapters, buses, controllers, or disks fail. Here are some examples: • In a cluster where one copy of data is shared between all nodes in the cluster, you may want to fail a package if the host adapter has failed on the node running the package.
Monitoring Disk Resources Rules for Using the HA Disk Monitor with ServiceGuard NOTE HA Monitor supports only the LVM multi-path technology with diskmond monitoring. The other multipath technologies such as EMC Powerpath, Autopath and Securepath are not supported. Setting Failover Parameters When using the HA Disk Monitor with ServiceGuard, the parameters listed in Table 2-6 should be set so that a package failover will occur when access to a disk resource fails.
Monitoring Disk Resources Rules for Using the HA Disk Monitor with ServiceGuard These rules apply when creating a PVG. If the rules are not followed, pv_summary will not be available for monitoring: • If PVGs are used, all physical volumes in a volume group must be in a PVG. • All PVGs in a volume group must have the same number of physical volumes.
Monitoring Disk Resources Rules for Using the HA Disk Monitor with ServiceGuard configure PV links into separate PVGs, p in Table 2-7 will always be equal to 1. Therefore any SCSI inquiry that does not return a value of UP for every path will result in a calculation of DOWN for pv_summary. Rules for RAID Arrays RAID configurations must be configured with PV links. PV links are redundant links attached to separate controllers on the array.
Monitoring Disk Resources Rules for Using the HA Disk Monitor with ServiceGuard PVG busB /dev/dsk/c2t1d0 /dev/dsk/c2t3d0 VG /dev/vgsing PVG busA /dev/dsk/c1t0d1 /dev/dsk/c1t2d1 PVG busB /dev/dsk/c2t1d1 /dev/dsk/c2t3d1 3. Carefully copy the /etc/lvmpvg to each system connected to the disk array. NOTE Make sure you edit lvmpvg to contain the correct link names in /dev/dsk/device for that system.
Monitoring Disk Resources Rules for Using the HA Disk Monitor with ServiceGuard 10/0.3.1 10/0.3.2 10/0.3.3 10/0.3.4 10/0.3.
Monitoring Disk Resources Rules for Using the HA Disk Monitor with ServiceGuard # vgcreate -g bus1 /dev/vgdatabase /dev/dsk/c0t15d0 # vgextend -g bus2 /dev/vgdatabase /dev/dsk/c0t3d0 LVM will now recognize the I/O channel represented by /dev/dsk/ c0t15d0 as the primary link to the disk; if the primary link fails, LVM will automatically switch to the alternate I/O channel represented by /dev/dsk/c1t3d0.
Monitoring Disk Resources Rules for Using the HA Disk Monitor with ServiceGuard no data available for the 2-way mirrored logical volume, but one copy still available for the 3-way mirrored volume. The pv_summary would be wrong for one of those mirrored disk configurations. • Volume groups representing the same hardware for failover must be created with exactly the same name on all nodes. For example, a bus connecting 3 nodes to a disk array must be defined as part of vg01 on all 3 nodes.
Monitoring Disk Resources Creating Disk Monitoring Requests Creating Disk Monitoring Requests There are two ways to create HA Disk Monitor requests: • From EMS GUI, to send alerts to HP OpenView ITO, Network Node Manager, email addresses, the console, a textlog file, or the system log. • From ServiceGuard, to configure any HA Disk Monitor resource as a package dependency. These requests are not exclusive. You can configure the HA Disk Monitor from both ServiceGuard and EMS.
Monitoring Disk Resources Creating Disk Monitoring Requests Disk Monitoring Request Suggestions The examples listed in Table 2-8 are valid for both RAID and mirrored configurations. Table 2-8 Suggestions for Creating Disk Monitor Requests To be alerted when ...
Monitoring Disk Resources Creating Disk Monitoring Requests Table 2-8 Suggestions for Creating Disk Monitor Requests (Continued) To be alerted when ... you have lost a mirror in your 2-way mirroring environment Resourc es to monitor lv/copies/ * Monitoring Parameters Notify when value is Value < Option 2 The following series of screens provide a sample process for creating an HA Disk Monitor request. These samples use the EMS GUI, though the Package Dependency screens in ServiceGuard are similar.
Monitoring Disk Resources Creating Disk Monitoring Requests Assume you want to be alerted when any disks fail and when they are back up. Figure 2-2 shows you can select all instances of pv_pvlink, so you only have to enter the parameters once for each volume group. You still need to create multiple pv_pvlink requests, one for each volume group on your system. Click OK to set monitoring parameters.
Monitoring Disk Resources Creating Disk Monitoring Requests The parameters for the monitoring request in Figure 2-3 request an event notification when the resource value is not equal to UP. The polling interval for checking the resources value is 300. The notification method is an SNMP trap with a minor severity level. No initial, repeat or return values are requested. Figure 2-3 Example: Configuring /vg/vg01/pv_pvlink/status Parameters to Notify When Disks Fail All requests are created in a similar way.
Monitoring Disk Resources Creating Disk Monitoring Requests Resources to Monitor for RAID Arrays These considerations are relevant to all RAID supported configurations listed at the beginning of this chapter.
Monitoring Disk Resources Creating Disk Monitoring Requests Figure 2-4 represents a node with two RAID arrays and two PV links. Figure 2-4 RAID Array Example Each LUN on the RAID array is in its own volume group: vgdance and vgsing. Assume this is one node in a 2-node cluster and you want to be notified when there is a failover, when any physical device fails, and when any logical volume becomes unavailable.
Monitoring Disk Resources Creating Disk Monitoring Requests To configure the EMS alerts, create the following requests: Table 2-10 Sample Disk Monitoring Requests Monitoring Parameters Resource Notify Condition Option /vg/vgdance/pv_summar y when value is > PVG_UP RETURN /vg/vgsing/pv_summary when value is > PVG_UP RETURN /vg/dance/lv_summary when value is >= INACTIVE RETURN /vg/vgsing/lv_summary when value is >= INACTIVE RETURN If pv_summary is SUSPECT, you know a physical device fa
Monitoring Disk Resources Creating Disk Monitoring Requests Table 2-11 Resources to Monitor for Mirrored Disks (Continued) vg/vgName/ lv_summary This gives you the status of data. If it is available on the logical volumes. vg/vgName/lv/ copies/* This gives you the total number of copies of data currently available. Copies in addition to the original copy. Figure 2-5 represents two nodes with 2-way mirrored configuration with 10 disks on 2 buses. Both copies are in a single volume group.
Monitoring Disk Resources Creating Disk Monitoring Requests To configure this last request, you must duplicate your ServiceGuard package dependency.
Monitoring Disk Resources Creating Disk Monitoring Requests Table 2-12 EMS Alert Requests (Continued) Monitoring Parameters Resource Notify /vg/vg01/lv/copies/* when value is <= Condition Option 1 RETURN Alerts need to be interpreted in relation to each other. In the table above, you would get an alert when PVG_UP is true. Although all data is available, the condition PVG_UP implies there are physical volumes that are not functioning and need to be fixed. See Table 2-15.
Monitoring Disk Resources Creating Disk Monitoring Requests Resources to Monitor for Lock Disks Lock disks are used as a tie-breaker in forming or reforming a cluster. If the lock disk is unavailable during cluster formation, the cluster may fail to reform. If you are using a lock disk with your cluster, you should configure a monitoring request for that disk and send an alert to your system management software if the lock disk is unavailable.
Monitoring Disk Resources Creating Disk Monitoring Requests Table 2-15 Root Volumes Monitoring Requests (Continued) Monitoring Parameters Resource Notify Condition Option /vg/vg00/lv_summary when value is not equ al UP RETURN /vg/vg00/lv/copies/lv01 when value is < 1 RETURN If one of the root volumes is unavailable, you are alerted and told which one has failed (pv_pvlink/status). You are alerted if you lose a root disk mirror.
Monitoring Disk Resources Creating Disk Monitoring Requests 58 Chapter 2
Monitoring Database Resources 3 Monitoring Database Resources The HA Database Monitor monitors values and sends events regarding the status of databases and the database servers that support them. These values are defined as part of the rdbms public MIB definition (RFC1697).
Monitoring Database Resources Database Monitor Reference Database Monitor Reference The HA Database Monitor reports events based on the status of supported databases configured on HP-UX systems. These MIB resources can be monitored: • Database resources: /rdbms/database/resource_class/database_name Information about a database on a given system, such as status and disk usage.
Monitoring Database Resources Database Monitor Reference Database Resources The database resources available for monitoring are defined under: /rdbms/database The database resource class name is then specified, followed by the database name. The database resource class names are: • status • allocated • usage • used The database name varies depending upon your environment and the number of databases installed. The minimum polling interval for all database resources is 30 seconds.
Monitoring Database Resources Database Monitor Reference Table 3-1 Interpreting Database Resource Classes Resource Name: /rdbms/database/resource_class/database_name resource_ class status allocated 62 Condition The values are: ACTIVE The database is currently being used by a database server. AVAILABLE The database is accessible, but it is not currently being used by a database server. UNAVAILABLE The database is not accessible to any database server.
Monitoring Database Resources Database Monitor Reference Table 3-1 Interpreting Database Resource Classes (Continued) Resource Name: /rdbms/database/resource_class/database_name resource_ class usage Condition Description a floating-point value expressed as a percentage This resource class describes the percentage of allocated space currently being used in the database indicating how full the database is and whether it is approaching capacity.
Monitoring Database Resources Database Monitor Reference Server Resources The database server resources available for monitoring are defined under /rdbms/server/, followed by the server resource class name, and then followed by the server name. The server resource class names are listed in Table 3-2. The server name varies, depending on your environment.
Monitoring Database Resources Database Monitor Reference Table 3-2 Interpreting Server Resource Classes (Continued) Resource Name: /rdbms/server/resource_class/server_name resource _ class status 1 allowed_ max_ connects Condition The values are: (continued) CONGESTED the database server is not accepting requests due to resource limitations RESTARTING the database server was restarted and will be available soon an integer value from the database server configuration a value of zero (0) indicates that
Monitoring Database Resources Database Monitor Reference Table 3-2 Interpreting Server Resource Classes (Continued) Resource Name: /rdbms/server/resource_class/server_name resource _ class 66 Condition Description commits_ per_sec a floating-point number This resource class describes the number of transactions per second completed by the database server. connects an integer This resource class describes the current number of simultaneous connections to the database server.
Monitoring Database Resources Database Monitor Reference Table 3-2 Interpreting Server Resource Classes (Continued) Resource Name: /rdbms/server/resource_class/server_name resource _ class Condition logical_ reads an integer This resource class describes the number of logical reads on the database server since it started. logical_ reads_ per_sec a floating-point number This resource class describes the number of logical reads per second on the database server.
Monitoring Database Resources Database Monitor Reference Table 3-2 Interpreting Server Resource Classes (Continued) Resource Name: /rdbms/server/resource_class/server_name resource _ class read_ cache_ hit_rate Condition Description a floating-point number, expressed as a percentage This resource class describes the ratio of logical reads less physical reads to logical reads, done by the database server: a value of 100 would imply that all reads are from the cache; in other words, the closer to 100, t
Monitoring Database Resources Database Monitor Reference Table 3-2 Interpreting Server Resource Classes (Continued) Resource Name: /rdbms/server/resource_class/server_name resource _ class usage Condition Description a floating-point number expressed as a percentage This resource class describes the percentage of maximum allowed connections to the database server currently in use.
Monitoring Database Resources Rules for Using the HA Database Monitor with ServiceGuard Rules for Using the HA Database Monitor with ServiceGuard The HA Database Monitor with ServiceGuard provides package failover if database servers fail or if the usage or number of connections exceeds specified levels.
Monitoring Database Resources Rules for Using the HA Database Monitor with ServiceGuard Setting Failover Parameters When using the HA Database Monitor with ServiceGuard, the ServiceGuard parameters listed in Table 3-3 should be set so that a package failover will occur when access to the database resource fails.
Monitoring Database Resources Rules for Using the HA Database Monitor with ServiceGuard Table 3-3 Setting Failover Parameters (Continued) Parameter 72 Recomm ended Setting File Location Notes RESOURCE_ UP_VALUE UP value ServiceGua rd package configuratio n file The condition that defines the UP state, for example, RESOURCE_UP_VALUE=UP RESOURCE_ POLLING_ INTERVAL number of seconds ServiceGua rd package configuratio n file Specify how often ServiceGuard will check the resource, for example once
Monitoring Database Resources Rules for Using the HA Database Monitor with ServiceGuard Sample File Settings The following is an example of how you might set up an ServiceGuard cluster, mycluster, with two nodes, nestle and whitman, to monitor the availability of a database, db_1, that is defined on a volume group, VG01, that can be accessed in exclusive mode by either nestle or whitman. Figure 3-2 shows the sample cluster setup.
Monitoring Database Resources Rules for Using the HA Database Monitor with ServiceGuard parameters needed to set up ServiceGuard. For a complete listing and explanation of all the parameters, refer to your Managing MC/ServiceGuard (B3936-90024) book. Table 3-4 lists the ServiceGuard package configuration file parameters that are used to configure the sample two-node called mycluster that is depicted in Figure 3-2.
Monitoring Database Resources Rules for Using the HA Database Monitor with ServiceGuard Table 3-4 Some ServiceGuard Package Configuration File Parameters Parameter Chapter 3 Sample Data PACKAGE_NAME SG_pkg1 NODE_NAME nestle NODE_NAME whitman RUN_SCRIPT_TIMEOUT 60 HALT_SCRIPT_TIMEOUT 60 RESOURCE_NAME /rdbms/server/status/db_1 RESOURCE_POLLING_INTERVAL 30 RESOURCE_START DEFERRED RESOURCE_UP_VALUE =UP 75
Monitoring Database Resources Rules for Using the HA Database Monitor with ServiceGuard Table 3-5 lists the ServiceGuard package control script parameters for the shared volume group, VG01.
Monitoring Database Resources Rules for Using the HA Database Monitor with ServiceGuard PFILE=$ORACLE_HOME/dbs/init.ora su oracle -c $ORACLE_HOME/bin/svrmgrl < export ORACLE_SID= PFILE=$ORACLE_HOME/dbs/init.
Monitoring Database Resources Creating Database Monitoring Requests Creating Database Monitoring Requests You can create monitor requests for each database that the database server supports. What specific values you use depends on your system’s configuration and available resources. For example, you may monitor database server status or database status to reflect the health of your system.
Monitoring Database Resources Creating Database Monitoring Requests Table 3-7 Sample Server Monitor Requests (Continued) Resources to monitor Chapter 3 Monitoring Parameters Notify Value Option commits_ per_sec when value is > some number depending on your expectation of database usage INITIAL connects when value is >= some number less than the allowed_max_ connects value INITIAL disk_reads at each interval n/a n/a disk_reads_ per_sec when value is some number depending on your expecta
Monitoring Database Resources Creating Database Monitoring Requests Table 3-7 Sample Server Monitor Requests (Continued) Resources to monitor Monitoring Parameters Notify logical_ writes_ per_sec when value is peak_ connects 1 Value Option some number depending on your expectation of database usage INITIAL at each interval n/a n/a read_cache_ hit_rate when value is 80 INITIAL started when value changes n/a n/a uptime at each interval n/a n/a usage 1 when value is > 80 INITIAL w
Dictionary File Command-Line Options A Dictionary File Command-Line Options This appendix lists the command-line options available for the HA Monitors. Typically, these options may be added to the dictionary file entry that describes how to launch a particular monitor.
Dictionary File Command-Line Options HA Database Monitor Command-Line Options HA Database Monitor Command-Line Options Perform additional HA Database Monitor configuration by using the following command-line options. Specify one or more of the below listed options in the MONITOR statement of the dictionary file for each monitor. For example, within the file: /etc/opt/resmon/dictionary/mibmond.dict. -c community The community string to use with the SNMP requests. The string public is used by default.
Dictionary File Command-Line Options HA Disk Monitor Command-Line Options HA Disk Monitor Command-Line Options Use the following command-line options with your HA Disk Monitor. These options may be specified in the MONITOR statement of the dictionary file for the HA Disk Monitor, for example, within the file: /etc/opt/resmon/dictionary/diskmond.dict. -d The /var/opt/resmon/log/diskmond.log file grows without bound. Only use this option if you really need a trace. Debugging and tracing is off by default.
Dictionary File Command-Line Options HA Disk Monitor Command-Line Options 84 Appendix A
Troubleshooting HA Monitors B Troubleshooting HA Monitors This appendix lists some troubleshooting guidelines for working with HA Monitors. The HA Monitors that rely on various SNMP MIBs need to have HP-UX SNMP subagents (and any other related “vendor specific” subagents) configured correctly and be running, before they can reliably report on the status of their resources.
Troubleshooting HA Monitors Table B-1 Event Monitoring Service Monitors (Continued) Monit or MIB Type? Associate d Product SNMP Required ? Documentati on Reference HA Cluster Monito r Yes EMS Yes Using the Event Monitoring Service (HP Part Number B7612-90015) HA Networ k Interfa ce Monito r Yes EMS Yes Using the Event Monitoring Service (HP Part Number B7612-90015) HA System Resour ce Monito r Yes EMS Yes Using the Event Monitoring Service (HP Part Number B7612-90015) The sections in t
Troubleshooting HA Monitors General MIB Monitor Troubleshooting General MIB Monitor Troubleshooting Review the following troubleshooting hints to help ensure that your environment is set up correctly: • Refer to the standard /var/adm/syslog/syslog.log file. It is always useful when troubleshooting system and ServiceGuard concerns. • Certain log files may grow without bound. This may fill up file systems and cause unpredictable behavior in SNMP.
Troubleshooting HA Monitors Database Monitor Troubleshooting for Oracle Database Monitor Troubleshooting for Oracle For Oracle MIB monitors, review the following troubleshooting hints. • If MIB resource classes under rdbms continue to be unavailable, there might be a problem with the Oracle SNMP daemons. For Oracle, these are ora_naaagt, master_peer, dbsnmp, or tnslsnr. Try using the following commands to stop and restart Oracle SNMP: su oracle -c “cd $ORACLE_HOME/bin; .
Troubleshooting HA Monitors Database Monitor Troubleshooting for Oracle • The HA Database Monitor relies on the proper installation and configuration of the Oracle Net8 product and processes (ora_naaagt, master_peer, dbsnmp, and tnslsnr). If you are able to connect to the database using the Oracle sqlplus utility, then the HA Database Monitor should also work. To verify Oracle Net8 connectivity, run the Oracle sqlplus utility from a client system that uses the same tnsnames.
Troubleshooting HA Monitors Database Monitor Troubleshooting for Informix Database Monitor Troubleshooting for Informix For Informix, the SNMP environment is established by issuing the following command, either before or after the database instance is started: onsrvapd -rall -k0 onsrvapd is the Informix daemon, which launches the Informix SNMP subagent (onsnmp), if there is an Informix database instance running on the node. If there is no Informix instance running, onsnmp will not be started.
Troubleshooting HA Monitors Debug Logging of EMS HA Monitors Debug Logging of EMS HA Monitors The debug logging of the EMS HA Monitors (mibmond, lanmond, fsmond, pkgmond, svcmond, clustermond, diskmond, rdbmsmond) can be enabled by modifying the monitor’s dictionary file, by adding the options "-d -l" to the monitor invocation string and restarting it. See also the manual pages for the monitors.
Troubleshooting HA Monitors Debug Logging of EMS HA Monitors When changing the start-up string of an EMS Monitor in the dictionary file, its persistence file name in /etc/opt/resmon/persistence will change. The file name of the persistence file is obtained by running a hash algorithm on the monitor start-up string stored in the dictionary file.
Troubleshooting HA Monitors Troubleshooting 0 Byte snmpd.conf Problem Troubleshooting 0 Byte snmpd.conf Problem If the size of /etc/SnmpAgent.d/snmpd.conf is zero, then the snmp daemon will not work and hence our MIB monitors (mibmond, pkgmond, clustermond, lanmond) will not behave as expected. This may result in loss of persistence requests. To troubleshoot this problem, check the size of /etc/SnmpAgent.d/snmpd.conf with the following command: ls -rlt /etc/SnmpAgent.d/snmpd.
Troubleshooting HA Monitors Steps to Obtain EMS Data to Reproduce an EMS Problem Steps to Obtain EMS Data to Reproduce an EMS Problem If you are about to reproduce an EMS problem, you should obtain a full set of EMS data that allows to get all logfiles and configuration information. Here is an example for a diskmond problem. 1. Enable debugging for EMS by issuing the command # touch /etc/opt/resmon/debug 2. Enable diskmond logging and debugging. # vi /etc/opt/resmon/dictionary/diskmond.
Troubleshooting HA Monitors Steps to Obtain EMS Data to Reproduce an EMS Problem 4. Set up everything for reproduction. Backup the /etc/opt/resmon/ tree: # mkdir -p /tmp/RESMON/before # cp -Rp /etc/opt/resmon/* /tmp/RESMON/before Save logfiles (if needed): # # # # cd /etc/opt/resmon/log tar cvf /tmp/oldlogs.tar * cd /var/opt/resmon/log tar rvf /tmp/oldlogs.tar diskmond.log Clear logfiles: # for i in /etc/opt/resmon/log/*log* /var/opt/resmon/log/diskmond.log > do > rm $i > done 5.
Troubleshooting HA Monitors Steps to Obtain EMS Data to Reproduce an EMS Problem NOTE 96 If you are not troubleshooting diskmond, make sure that you include the specific logfiles of the EMS Monitor you are looking at. Refer to the documentation of the EMS Monitor to find the location of the logfile.
Glossary A-H I-K alert An event. A message sent to warn a user or application when certain conditions are met. ITO HP OpenView IT/Operations, formerly known as Operations Center. It is a software application that provides central operations and problem management for a multi-vendor distributed system. client The application that creates or cancels requests to monitor particular resources. The consumer of a resource status message. A user of the Resource Monitor framework.
Glossary MIB II (MIB2) Information” (SMI) format. This grammar concisely defines the objects being managed, the data types these objects take, descriptions of how the objects can be used, whether the objects are read-only or read-write, and identifiers for the objects. PV links A method of LVM configuration that allows you to provide redundant SCSI interfaces and buses to disk arrays, thereby protecting against single points of failure in SCSI cards and cables.
Glossary volume group resource and send event notifications if appropriate. A monitor checks resources on the local system. The resource monitor maps the physical resource into a standard interface understood by EMS. S-T SNMP (Simple Network Management Protocol) Standard protocol for network based retrieval of information about system resources. state The current value of a resource (UP or DOWN).
Glossary volume group 100 Glossary
Index A allocated database resource, 61, 62 allocated database resource, 61 allowed_max_connects server resource, 64, 65 alternate links creating volume groups with, 41 C calculating pv_summary, 40 cluster, 37 cluster monitor, 60 example requests, 78 cluster status, 64 ClusterView, 60 commits server resource, 64, 65 commits_per_sec server resource, 64, 66 configuring EMS with MC/ServiceGuard, 37 connects server resource, 64, 66 creating disk monitoring requests, 45 creating logical volumes, 43 creating volu
Index lv/copies, 35 lv/status logical volume status, 35 lv_summary, 33 LVM, rules for using with disk monitor, 38 lvmpvg file, 40 M MC/ServiceGuard, 10, 29 MC/ServiceGuard, rules for using with EMS, 37 MirrorDisk/UX, 35 mirrors example requests, 52 number of copies, 35 rules for using with disk monitor, 43 split off, 35, 36, 44 monitor API, 22 view information, 21 monitor request, 14, 24 example disk monitor request, 49 monitoring request cluster status, 64 for clusters, 60 for disk monitor, 45 for lock di
Index connects, 64, 66 disk_reads, 66 disk_reads_per_sec, 66 disk_writes, 66 disk_writes_per_sec, 66 logical_reads, 67 logical_reads_per_sec, 67 logical_writes, 67 logical_writes_per_sec, 67 peak_connects, 64, 67 read_cache_hit_rate, 68 started, 64, 68 status, 64, 65 uptime, 64, 68 usage, 64, 69 write_cache_hit_rate, 69 server resources, 60 SNMP traps, 10 split off mirrors, 35, 36, 44 started server resource, 64, 68 status database resource, 61, 62 server resource, 64, 65 supported disks, 28 system requirem