
HP Code Advisor

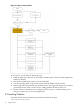

Example 2-3 Generating code complexity metrics
To store the code complexity metrics in the PDB with Indirect Call Targets, use the following
command.
$cadvise +metrics=ict -pdb test.pdb aCC -c example.c
To get the metrics in the my.metrics file, use the following command.
$cadvise +metrics :out=my.metrics aCC -c example.c
To store the metrics in the my.metrics file without Indirect Call Targets, use the following
command.
$cadvise +metrics :out=pdb -pdb test.pdb aCC -c example.c
The program complexity metrics are stored in a specified output location. The output location
can either be specified as the pdb (out=pdb) or a file <filename>(out=<filename>). Inserting
a + before the <filename> appends the metrics to the file <filename>. If the output location
is not specified, then these metrics are written either to a PDB, if a PDB is present, or to the file
<objfile>.metrics.
Cadvise emits the following metrics for determining program complexity:
• For a source file
— Number of header files included
— Total number of lines in the source file
— Number of comment lines
— Number of blank lines
— Number of lines of code
— Number of mixed lines (lines have both code and comments)
— Number of global variables
— Number of static variables
— Total number of functions defined
— Number of externally visible functions defined
— Number of global Thread Local Storage (TLS) Variables
— Number of static Thread Local Storage (TLS) Variables
— Number of global mutexes
— Number of static mutexes
— Program complexity metrics for each of the functions
• For a function
— Function Signature
— Total number of lines
— Number of comment lines
— Number of blank lines
— Number of lines of code
— Number of mixed lines
— Number of macros used
— Number of local variables defined
— Number of static variables defined
— Number of if statements
— Number of return statements
— Number of loop nests
— Nesting level of each loop nest
— Number of indirect calls
2.7 Generating Code Complexity Metrics 19