Using the Event Monitoring Service Manufacturing Part Number : B7609-90049 June 2007 © Copyright 1997, 2003, 2007 Hewlett-Packard Development Company, L.P.
Legal Notices Confidential computer software. Valid license from HP required for possession, use or copying. Consistent with FAR 12.211 and 12.212, Commercial Computer Software, Computer Software Documentation, and Technical Data for Commercial Items are licensed to the U.S. Government under vendor's standard commercial license. The information contained in this document is subject to change without notice.
Contents 1. Understanding the Event Monitoring Service Event Monitoring Service Overview . . . . . . . . . . . . . . . . . . . . . . . . . . . . . . . . . . . . . . . . EMS Requirements . . . . . . . . . . . . . . . . . . . . . . . . . . . . . . . . . . . . . . . . . . . . . . . . . . . . . EMS Resource Classes. . . . . . . . . . . . . . . . . . . . . . . . . . . . . . . . . . . . . . . . . . . . . . . . . . . Client and Target Applications . . . . . . . . . . . . . . . . . . . . . . . . . . . . . . . . . .
Contents Viewing Monitoring Requests . . . . . . . . . . . . . . . . . . . . . . . . . . . . . . . . . . . . . . . . . . . . . 46 4. Monitoring ServiceGuard Package Dependencies 5. Monitoring Network Interfaces Network Monitor Reference . . . . . . . . . . . . . . . . . . . . . . . . . . . . . . . . . . . . . . . . . . . . . . 50 Configuring Network Monitoring Requests . . . . . . . . . . . . . . . . . . . . . . . . . . . . . . . . . . 52 6.
Contents High Availability Monitors. . . . . . . . . . . . . . . . . . . . . . . . . . . . . . . . . . . . . . . . . . . . . . EMS Tracing . . . . . . . . . . . . . . . . . . . . . . . . . . . . . . . . . . . . . . . . . . . . . . . . . . . . . . . . . Performance Considerations . . . . . . . . . . . . . . . . . . . . . . . . . . . . . . . . . . . . . . . . . . . . . . System Performance Issues . . . . . . . . . . . . . . . . . . . . . . . . . . . . . . . . . . . . . . . . . . . . .
Contents 6
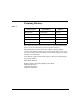
Printing History Table 1 Printing Date Part Number Edition March 1999 B7612-90009 Edition 1 November 1999 B7612-90015 Edition 2 June 2003 B7609-90022 Edition 3 February 2007 B7609-90045 Edition 4 June 2007 B7609-90049 Edition 5 This edition documents material related to using the Event Monitoring Service to create monitoring requests for system resources. The printing date changes when a new edition is printed.
Preface This guide describes how to use the Event Monitoring Service (EMS) and how to configure the Management Information Base (MIB) monitors. The MIB monitors check and report status on cluster, network, and system resources. Audience HP intends this manual for system managers or administrators responsible for configuring and maintaining the Event Monitoring Service (EMS) on HP-UX 11i Versions 1 and 2.
Related Publications The following documents contain additional related information: • Using High Availability Monitors • EMS Hardware Monitors User’s Guide • Managing MC/ServiceGuard • Configuring OPS Clusters with ServiceGuard OPS Edition • Managing Systems and Workgroups • Peter Weygant, Clusters for High Availability: A Primer of HP-UX Solutions (ISBN 0-13-089335-2). HP Press: Prentice Hall, Inc., 2001 • Tom Madell, Disk and File Management Tasks on HP-UX (ISBN 0-13-518861-X).
Understanding the Event Monitoring Service 1 Understanding the Event Monitoring Service The Event Monitoring Service (EMS) is a framework for resource monitoring. EMS is used by system administrators to monitor system resources including configuring, checking resource status, and sending notification when configured conditions are met.
Understanding the Event Monitoring Service Event Monitoring Service Overview Event Monitoring Service Overview The Event Monitoring Service (EMS) monitors system resources. Use EMS to configure monitoring requests, check resource status, and send notification when configured conditions are met. EMS can work in a high availability environment. It can report a loss of redundant resources.
Understanding the Event Monitoring Service Event Monitoring Service Overview This option does not require any extra handling. Specify the email address when the monitoring request is created. — syslog and textlog This option does not require any extra handling. Specify the log file when the monitoring request is created. Syslog notifications go to the local system. — console This option does not require any extra handling. Specify the console when the monitoring request is created.
Understanding the Event Monitoring Service Event Monitoring Service Overview Developers use the API to create additional monitors for use with client and target applications, such as the EMS GUI, EMS CLI or ServiceGuard. Monitor components to be created include: resource dictionary, resource monitor binary file, manpage (recommended), and message catalog (recommended). Figure 1-1 shows the relationships between the Event Monitoring Service components.
Understanding the Event Monitoring Service Event Monitoring Service Overview • monconfig utility • resls or resdata commands 2. The EMS API provides the interface between the client request and the registrar. There is a one to one correspondence between the client and the registrar. 3. The registrar refers to the dictionary for a list of available resources and related monitors. The resources listed in the dictionary are passed back to the client. 4.
Understanding the Event Monitoring Service Event Monitoring Service Overview 8. The registrar passes completed monitoring requests down to the appropriate resource monitor application. 9. The monitor checks the resource as specified in the monitor request. It passes back to the EMS API whether the request is accepted or rejected. 10. The EMS API provides the interface between the monitor and the target. 11. The monitor begins collecting data as specified in the monitoring request. 12.
Understanding the Event Monitoring Service EMS Requirements EMS Requirements The following are system requirements for the Event Monitoring Service: NOTE • All hardware you intend to monitor, such as disks and LAN cards, have been configured and tested prior to configuring EMS. • EMS must be installed on an HP 9000 or Series 800 system running HP-UX version 10.20 or later. For more information on system requirements, refer to the EMS Release Notes.
Understanding the Event Monitoring Service EMS Resource Classes EMS Resource Classes EMS groups resources into classes in a hierarchy similar to that of a filesystem structure. Figure 1-2 is an example of a resource hierarchy.
Understanding the Event Monitoring Service Client and Target Applications Client and Target Applications This section describes some of the client and target application options and processes. Target applications can be written using the EMS API. EMS with ServiceGuard ServiceGuard can be configured with EMS to monitor the health of selected resources, such as disks. Based on the status of the resources, ServiceGuard can decide to fail packages over.
Understanding the Event Monitoring Service Client and Target Applications The full path of a resource includes the resource class hierarchy and instance. An example of a full resource path for the physical volume status of the device /dev/dsk/c0t1d2 belonging to volume group vgDataBase, is /vg/vgDataBase/pv_pvlink/status/c0t1d2. 2. Specify when to collect the value. Select either and/or all: • When value is ... If you are setting up a request for an asynchronous monitor, this is the only option available.
Understanding the Event Monitoring Service Client and Target Applications • email • console • syslog • textlog • wbem EMS CLI Client Application emscli is a command line utility that is used to configure and manage persistent monitoring requests for Event Monitoring Service (EMS) monitors, such as, HA Monitors, Hardware Monitors and Kernel Monitors. The emscli utility can be used to add, modify, delete, list and view monitoring requests and resources.
Understanding the Event Monitoring Service Resource Monitors Resource Monitors Resource monitors are applications written to gather and report information about specific resources on the system. The resource monitor: • Provides a list of resources that can be monitored • Provides information about the resources • Monitors the resources it supports • Provides values to the EMS API notification The EMS framework evaluates the data to determine if an event has occurred.
Understanding the Event Monitoring Service Resource Monitors Writing Resource Monitors The EMS API provides a method for writing new resource monitors. To create your own monitor, read the Writing Monitors for the Event Monitoring Service (EMS) manual and install the developer’s kit. Both are available at the following Website: 1. Go to the Website, http://software.hp.com 2.
Understanding the Event Monitoring Service EMS Framework Components EMS Framework Components This section describes the EMS framework components. The EMS API The EMS API is the interface between the registrar, client applications, target applications, and resource monitors as illustrated in Figure 1-1. The EMS API is provided as part of the EMS product.
Understanding the Event Monitoring Service EMS Framework Components The registrar does not need to keep any state information and does not need to be highly available. It does not need to be running while a resource is being monitored. The registrar is needed only to start the monitors and to provide communication between clients and monitors. One registrar process is started each time a client application calls rm_client_connect(), so a registrar is always connected to one client.
Understanding the Event Monitoring Service EMS Framework Components When the registrar needs to pass the request to a resource monitor, it needs to determine if the resource monitor is currently running. If the appropriate resource monitor process is not found, the registrar starts the process and waits until the resource monitor can communicate with the registrar. The Resource Dictionary The resource dictionary is the mechanism by which the resource monitor identifies itself to EMS.
Defining a Monitoring Request 2 Defining a Monitoring Request This chapter contains the following sections: Chapter 2 • Starting a Monitoring Request • Specifying when to send Event Notifications • Setting the Polling Interval • Setting Event Value Options • Selecting Protocols for Sending Events • Adding a Notification Comment 27
Defining a Monitoring Request Starting a Monitoring Request Starting a Monitoring Request After you have selected a resource to monitor, use the Monitoring Request Parameters screen to specify when and how to send event notification (Figure 2-1). The following sections describe the monitoring parameters and provide examples of common applications.
Defining a Monitoring Request Specifying when to send Event Notifications Specifying when to send Event Notifications When you create a request, you specify the conditions under which you want to collect resource status values. While the monitor may be polling disks every five minutes, for example, you may only want to be alerted when something happens that requires your attention. Specify these conditions in the Notify area of the Monitoring Request Parameters screen.
Defining a Monitoring Request Specifying when to send Event Notifications To set an event trigger: • Select from the listed options in the Notify area (When value is..., When value changes, or At each interval). Asynchronous monitors are event-driven, rather than polled. They generate messages as events occur. Therefore, if the request is for an asynchronous monitor, only the When value is... option is available.
Defining a Monitoring Request Setting the Polling Interval Setting the Polling Interval The polling interval specifies how often the resource monitor checks the resource value. The polling interval is the maximum amount of elapsed time before a monitor knows about a change in status for a particular resource. The shorter the polling interval, the more likely you are to have recent data. However, depending on the monitor, a short polling interval may use too much CPU and system resources.
Defining a Monitoring Request Setting Event Value Options Setting Event Value Options If you select the When value is... from the list in the Notify area, the Options area displays three choices. Select one or more of these three options: Initial Use this option to establish a baseline when monitoring resources such as available filesystem space or system load. It can also be used to test whether newly requested events are being sent. Repeat Use this option for urgent alerts.
Defining a Monitoring Request Selecting Protocols for Sending Events Selecting Protocols for Sending Events Through the Notify via area, specify the protocol you want the monitor to use to send events. The options are described in the following sections. The opcmsg (ITO) Option This option sends messages to ITO applications via the opcmsg daemon. For this option to display, IT Operation Managed Node Software 3.x or 4.x must be installed on the resource server running HP-UX version 10.20.
Defining a Monitoring Request Selecting Protocols for Sending Events Certain monitors can map directly to OPC severity levels. This is not available with all monitors. Select Map from value option from the list in the Severity area. If opcmsg is selected, EMS sets the following fields: • ITO application group: EMS (HP) • message group: HA • object: to the full path of the resource being monitored See HP OpenView IT/Operations Administrators Task Guide (Part Number B4249-90003) for more information.
Defining a Monitoring Request Selecting Protocols for Sending Events 2. Specify the target host name and the port in their respective fields. The snmp Traps Option This sends messages to applications, such as Network Node Manager that use SNMP traps. See HP OpenView Using Network Node Manager (P/N J1169-90002) for more information on configuring SNMP traps. Table 2-2 lists traps used by EMS: Table 2-2 SNMP Traps Trap Name Chapter 2 Trap Value Descripti on EMS_ ENTERPRISE_ OID "1.3.6.1.4.1.11.2.3.1.
Defining a Monitoring Request Selecting Protocols for Sending Events Table 2-2 SNMP Traps (Continued) Trap Name Trap Value Descripti on EMS_MINOR_ SEV_OID "1.3.6.1.4.1.11.2.3.1.7.0.7" Problem Event w/Minor Severity EMS_MAJOR_ SEV_OID "1.3.6.1.4.1.11.2.3.1.7.0.8" Problem Event w/Major Severity EMS_CRITICA L_SEV_OID "1.3.6.1.4.1.11.2.3.1.7.0.
Defining a Monitoring Request Selecting Protocols for Sending Events • When value changes: If this notification option is set, a non-normal severity occurs when the current value does not match the previous value Certain SNMP monitoring requests can map directly to severity levels. Select the Map from value option from the list in the Severity area. To set the SNMP trap, execute the following steps: 1. Specify the notification type from the list in the Notify area. 2.
Defining a Monitoring Request Selecting Protocols for Sending Events An abnormal event message (error) is returned under the following conditions: • When value is . . . - If this notification option is set, a non-normal severity occurs when the value changes from FALSE to TRUE. For example, if a disk is being monitored, you want notification when the disk is down. The When value is condition is FALSE while the disk is up and running correctly.
Defining a Monitoring Request Adding a Notification Comment Adding a Notification Comment The notification comment is useful for sending task reminders to recipients of an event. For example, you can configure a disk monitor request that reports an alert when an entire mirror has failed. When that event shows up in IT/Operations, you may want a notification comment to include the name of the person to contact. You can use emscli to add a notification comment.
Defining a Monitoring Request Adding a Notification Comment 40 Chapter 2
Changing Monitoring Requests 3 Changing Monitoring Requests This chapter contains the following sections: Chapter 3 • Copying Monitoring Requests • Modifying Monitoring Requests • Removing Monitoring Requests • Viewing Monitoring Requests 41
Changing Monitoring Requests Copying Monitoring Requests Copying Monitoring Requests There are two ways to use the copy function: • To create requests for multiple resources using the same monitoring parameters. • To create requests for the same resource using different monitoring parameters. To create requests for multiple resources using the same monitoring parameters: 1. From the Event Monitoring Service main screen, select the monitoring request whose parameters you wish to copy.
Changing Monitoring Requests Copying Monitoring Requests 4. Modify the parameters as desired in the Monitoring Request Parameters screen. 5. Click OK. A message is displayed to indicate that the new request has been added. The Event Monitoring Service main screen is displayed. NOTE Chapter 3 There is no option to copy monitoring requests using emscli.
Changing Monitoring Requests Modifying Monitoring Requests Modifying Monitoring Requests To change the monitoring parameters of a request: 1. From the Event Monitoring Service main screen, select the monitoring request you want to modify and either: • Double click the request, or • Select Actions menu: Modify You see the Monitoring Request Parameters screen. 2. Modify the parameters as desired, by editing the fields in the Monitoring Request Parameters screen. 3. Click OK.
Changing Monitoring Requests Removing Monitoring Requests Removing Monitoring Requests You can remove one or more monitoring requests using the Remove Monitoring Requests option. To remove monitoring requests, execute the following steps: 1. From the Event Monitoring Service main screen, select the monitoring request you wish to remove. To select contiguous multiple requests, hold the Shift key and click. To select individual multiple requests, hold the Ctrl key and click. 2.
Changing Monitoring Requests Viewing Monitoring Requests Viewing Monitoring Requests To view the parameters for a monitoring request: 1. From the Event Monitoring Service main screen, select the monitoring request you wish to view. 2. Select Actions menu: View You see the View Monitoring Request Parameters screen with the parameters specified for the monitoring request. 3. To modify the parameters of this request, click the Modify Monitoring Request option. You see the Monitoring Request Parameters screen.
Monitoring ServiceGuard Package Dependencies 4 Monitoring ServiceGuard Package Dependencies This chapter describes how to use HP SMH to define package dependencies on EMS resources. ServiceGuard by itself automatically monitors specific resources. Using ServiceGuard with EMS adds to the list of resources that can be monitored. These resources need to be configured and identified to ServiceGuard as package resource dependencies.
Monitoring ServiceGuard Package Dependencies NOTE 48 Create the same requests on all nodes configured for a ServiceGuard package.
Monitoring Network Interfaces 5 Monitoring Network Interfaces The HA Network Interface Monitor detects whether your LAN interface is UP or DOWN. It allows you to send events to a system management interface as an alternative to looking in syslog for LAN status. The HA Network Interface Monitor, lanmond, is part of the MIB Monitors package.
Monitoring Network Interfaces Network Monitor Reference Network Monitor Reference The HA Network Interface Monitor provides status on the LAN interfaces in a given node. It monitors all the interfaces that you see when you run the lanscan command on a system. The HA Network Interface Monitor is part of the MIB Monitors package. Table 5-1 lists the HA Network Interface Monitor.
Monitoring Network Interfaces Network Monitor Reference To verify the operational status of the LAN interface, use the lanscan (1M) or lanadmin(1M) commands. Table 5-2 Interpreting LAN Interface Status Resource Name: /net/interfaces/lan/status/LANname Conditio n Value UP 1 The LAN interface is sending and receiving packets. DOWN 2 The LAN interface is not passing operational packets.
Monitoring Network Interfaces Configuring Network Monitoring Requests Configuring Network Monitoring Requests Table 5-3 recommends two monitoring requests for each node. With these requests, you will see events when a LAN card failed, and again when it came back up, and you will see an event every hour that the LAN card was down. You may elect to change the polling interval or not to configure a reminder at all.
Selecting Resources to Monitor 6 Selecting Resources to Monitor This chapter contains the following sections: Chapter 6 • Starting the Event Monitoring Service • Selecting Resources • Viewing Resource Descriptions 53
Selecting Resources to Monitor Starting the Event Monitoring Service Starting the Event Monitoring Service To start the EMS GUI: 1. Log on as root to the system and start the graphical version of HP SMH. 2. Type the following command at the HP-UX prompt: smh -w The home page of HP SMH opens. NOTE The DISPLAY variable must be set to start HP SMH GUI using this command. You can also start HP SMH in a web browser by typing http://:2301 in the address bar of the browser. 3.
Selecting Resources to Monitor Starting the Event Monitoring Service If Sentinel monitors are installed, the screen is simply blank. Figure 6-1 Event Monitoring Service Main Screen To start the EMS CLI, enter emscli with the relevant command line option at the HP-UX command line prompt. For example, enter emscli -a /system/numUsers to add a new monitoring request. Enter emscli -h to view the usage of various options supported by emscli.
Selecting Resources to Monitor Selecting Resources Selecting Resources Resources are divided into classes. To select a resource to monitor: 1. From the Event Monitoring Service main screen, click on the Actions menu. A resource in the EMS TUI can be selected by choosing F1 + keys for vt100 terminals and F2 + keys for hpterm. Refer to the section, “Starting the Event Monitoring Service” on page 54 for instructions on starting EMS. 2. Select the Add Monitoring Request menu item.
Selecting Resources to Monitor Selecting Resources a. From the command line, go to the /etc/opt/resmon/dictionary directory. Information about each monitor can be found in the .dict files. b. View the monitor dictionary file. The file name corresponds to its monitor. The file extension is .dict. For example, the MIB Monitor dictionary filename is mibmond.dict. • Review the manpage. The manpage name can be found in the dictionary file with the monitor’s name.
Selecting Resources to Monitor Selecting Resources The EMS Monitoring Request Parameters screen has a View Resource Description button that displays additional information supplied by the selected resource. See Figure 6-2. Figure 6-2 EMS Monitoring Request Parameters Screen 3. Double click on a resource class. When you monitor a resource, you actually monitor one or more specific instances of its resource class.
Selecting Resources to Monitor Selecting Resources If the resource class has subclasses, those subclasses are listed in the Resource Classes field. Asynchronous monitors are event-driven, rather than polled. They generate messages as events occur, without regard for relative importance. Therefore, if the resource instance is an asynchronous monitor, the Current Value field does not apply, and the field displays n/a. Figure 6-3 Add or Copy Monitoring Request Screen 4.
Selecting Resources to Monitor Selecting Resources The (*) wildcard is a convenient way to create many requests at once. Most systems have more than one disk or network card, and many have several disks. To avoid having to create a monitor request for each disk, select *(All Instances) in the Resource Instance box. The *(All Instances) listing is always the first item on the list. See the figure above.
Selecting Resources to Monitor Viewing Resource Descriptions Viewing Resource Descriptions Resource class and resource instance descriptions are available for each resource. To see a resource class description, click the Show Class Description button from the Add or Copy Monitoring Request screen.
Selecting Resources to Monitor Viewing Resource Descriptions 62 Chapter 6
Monitoring System Resources 7 Monitoring System Resources The HA System Resource Monitor sends events about the number of users, available file system space, and job queues to help you load-balance and tune your system to keep it available. It is an alternative to reading syslog files to get this information. The HA System Resource Monitor, pkgmond, is part of the MIB Monitors package.
Monitoring System Resources System Monitor Reference System Monitor Reference The system monitor reports information on the following system resources: • /system/numUsers - number of users on a given node. • /system/jobQueue1Min, /system/jobQueue5Min, and /system/jobQueue15Min - number of processes waiting for CPU and performing disk I/O as an average over 1, 5, and 15 minutes respectively. This is the same as the load averages reported by uptime (1).
Monitoring System Resources System Monitor Reference Figure 7-1 shows the system resource monitor hierarchy. Items in boxes are resource instances that can be monitored. The fsName in italics changes depending on the names of the file systems. Figure 7-1 System Resource Monitor Class Hierarchy Number of Users The number of users tells you how many users are logged in to a given system.
Monitoring System Resources System Monitor Reference The minimum polling interval is 30 seconds. A longer interval is recommended. Short polling intervals may adversely affect system performance.
Monitoring System Resources System Monitor Reference Job Queues The job queue monitor checks the average number of processes that have been waiting for CPU and performing disk I/O over the last 1, 5, or 15 minutes. A value of 4 in /system/jobQueue5Min means that at the time of polling there was an average of 4 jobs in the queue over the last 5 minutes.
Monitoring System Resources System Monitor Reference Filesystem Available Space The filesystem monitor checks the number of megabytes available for use in each file system on the node. File systems must be mounted and active to be monitored. File systems mounted over the network, such as NFS file systems, are not monitored. The MIB variables fileSystemBavail, and fileSystemBsize from the hp-unix MIB are used to calculate the number of available KB in the file systems.
Monitoring System Resources Creating System Resource Monitoring Requests Creating System Resource Monitoring Requests Table 7-5 shows examples of how you can monitor system resources. Table 7-5 Examples of System Resource Requests Monitoring Parameters Chapter 7 To be alerted when...
Monitoring System Resources Creating System Resource Monitoring Requests Table 7-5 Examples of System Resource Requests (Continued) Monitoring Parameters To be alerted when... file systems are running out of space Resources to monitor /system/filesyste m/availMb for: /home /opt /root /stand /tmp /usr /var Notify when value is < Valu e Option 50 INITIAL The job queue and file system resources have the INITIAL option set to give a baseline for comparison.
Monitoring Cluster Resources 8 Monitoring Cluster Resources The HA Cluster Monitor sends events regarding the status of a cluster. It is recommended that you use ServiceGuard Manager to monitor cluster status and receive cluster events. HA Cluster Monitor is primarily for use with non-OpenView systems, for example, CA UniCenter.
Monitoring Cluster Resources Cluster Monitor Reference Cluster Monitor Reference The HA Cluster Monitor is useful in environments not running HP OpenView with ServiceGuard Manager. The HA Cluster Monitor reports information on the status of the cluster to which the local node belongs. The resources monitored are: • /cluster/status/clustername, a summary of the state of all nodes in the cluster clustername • /cluster/localNode/status/clustername, the status of a given node in a cluster.
Monitoring Cluster Resources Cluster Monitor Reference Figure 8-1 shows the cluster monitor class hierarchy. Figure 8-1 Cluster Monitor Resource Class Hierarchy Items in boxes are resource instances that can be monitored. Variables in italics change depending on the names of the clusters and packages on the system. Cluster Status The cluster status is the status of the MC/ServiceGuard cluster to which a particular node belongs.
Monitoring Cluster Resources Cluster Monitor Reference Table 8-2 Interpreting Cluster Status (Continued) Resource Name: /cluster/status/clusterName Conditi on Valu e UNKNOWN 2 The node may be separated from other active cluster elements (for example the heartbeat LAN) and has insufficient information to tell if the cluster is accessible. DOWN 3 The node cannot access the cluster. Interpretation You can create a request to be notified when the cluster is not UP.
Monitoring Cluster Resources Cluster Monitor Reference Node Status The node status is the current status of a node relative to a particular cluster. The hp-mcCluster MIB variable, hpmcNodeStatus, provides the node status information to the monitor. The cmviewcl -v command displays detailed information about the current status of the cluster and packages on the cluster.
Monitoring Cluster Resources Cluster Monitor Reference Package Status The package status is the status of each package running on this node. The HP-MCCLUSTER MIB variable, hpmcSGPkgStatus, provides the package status information to the monitor. The cmviewcl -v command displays detailed information about the current status of the cluster and packages on the cluster.
Monitoring Cluster Resources Cluster Monitor Reference Service Status A service is part of a package. The service status is the status of each service running on this node. The HP-MCCLUSTER MIB variable, hpmcSGPkgSvcStatus, provides the service status information to the monitor. The cmviewcl -v command displays detailed information about the current status of the cluster and services on the cluster.
Monitoring Cluster Resources Creating Cluster Monitoring Requests Creating Cluster Monitoring Requests For most ServiceGuard or cluster configurations, create the following requests on each node in a cluster: Table 8-6 Recommended Cluster Requests Resources to monitor Monitoring Parameters Notify Value Option /cluster/status/ clusterName when value is not equa l UP INITIAL /cluster/localNode/ status/clusterName when value is not equa l RUNNING INITIAL /cluster/package/ status/ packageName w
Dictionary File Command Line Options A Dictionary File Command Line Options This appendix lists the command line options available for the MIB Monitors. Typically, these options may be added to the dictionary file entry that describes how to launch a particular monitor.
Dictionary File Command Line Options MIB Monitor Command-Line Options MIB Monitor Command-Line Options Perform additional MIB monitor configuration by using the following command-line options. This includes the HA Cluster Monitor, HA Network Interface Monitor, and HA System Resource Monitor. Specify one or more of the below listed options in the MONITOR statement of the dictionary file for each monitor. For example, within the file: /etc/opt/resmon/dictionary/mibmond.dict.
Troubleshooting B Troubleshooting This section gives hints on testing your monitoring requests, and gives you some information about log files and monitor behavior that will help you determine the cause of problems. For information on fixing problems detected by monitors, see the list of related publications in the Preface.
Troubleshooting EMS Directories and Files EMS Directories and Files EMS files are located in /etc/opt/resmon and /opt/resmon. Table B-1 lists files and directories that might help you determine the cause of some problems: Table B-1 EMS Directories and Files /etc/opt/resmon/config This file determines how often EMS checks that monitors are running (have not died). /etc/opt/resmon/dictionary This directory contains resource dictionaries for the various monitors.
Troubleshooting EMS Directories and Files Table B-1 EMS Directories and Files (Continued) /etc/opt/resmon/log This directory contains a directory of log files used by EMS: • client.log stores calls made by clients, such as MC/ServiceGuard or other EMS clients. • api.log stores api calls made by monitors. • registrar.log contains errors found when reading the resource dictionary. • emsagent.log is the SNMP subagent responsible for sending EMS events through an SNMP trap.
Troubleshooting Logging and Tracing Logging and Tracing Use logging for most troubleshooting activities. By default the monitors log to api.log. Logging to /var/adm/syslog/syslog.log is ON by default for the disk monitor and OFF by default for the remaining monitors. Tracing should only be used when instructed to do so by HP support personnel. This is not available with all monitors. EMS Logging Log files in /etc/opt/resmon/log/ contain information logged by the monitors.
Troubleshooting Logging and Tracing Apart from 6 MB monitor disk space, you can reserve additional disk space for EMS monitors logging. To relocate the directory, enter the following commands: mkdir /newpath/resmon mv /etc/opt/resmon/log/newpath/resmon # create /newpath/resmon/log # remove /etc/opt/resmon/log ln -s /newpath/resmon/log /etc/opt/resmon/log NOTE EMS requires that /etc/opt/resmon, the parent directory, reside on the root file system. Do not move all of /etc/opt/resmon to another file system.
Troubleshooting Logging and Tracing • registrar.log All data logged by the registrar processes is stored in this file. Once the file reaches 500KB in size, it is automatically copied to registrar.log.old and the previous registrar.log.old file is lost. • emsagent.log The EMS subagent, emsagent, logs errors into the /etc/opt/resmon/log/emsagent.log file. • reslog.html Monitor data is archived in the file /etc/opt/resmon/log/reslog.html. All monitors write to the same file.
Troubleshooting Logging and Tracing • Stop EMS clients. • Kill all registrar processes. • Kill p_client. The p_client process will be restarted immediately. EMS monitor will be started if the persistent requests are present. The non persistent requests will be lost. Using resls to Check EMS Communication resls is a client application that can verify that the communication between client, registrar and a monitor works.
Troubleshooting Logging and Tracing • If 2) succeeds, the problem is most likely with the specific resource "/system/numUsers", since the query of the other resource of the same EMS monitor works fine. Using resls -s to Check the Status of an EMS Resource From EMS A.03.20 onwards, you can view the current value of the resource instance by using the new "-s" option with resls, e.g.
Troubleshooting Logging and Tracing The persistence file names are normally having the format m., where is created by using a hash algorithm on the EMS monitor start-up string stored in its dictionary file in /etc/opt/resmon/dictionary. If the invocation command changes (e.g. by adding command line options), the persistence file name also changes.
Troubleshooting Logging and Tracing Look at the registrar.log if you are having trouble finding resources that you suspect exist on your system. This log contains any errors that were encountered when trying to read the dictionary. If a dictionary is corrupt, the registrar will not be able to read it, and EMS will not be able to find the resources associated with that dictionary. EMS Tracing Some monitors provide tracing, which can be used for debugging monitor code.
Troubleshooting Performance Considerations Performance Considerations Monitoring your system is important to maintain high availability, but monitoring consumes system resources. You must carefully consider your performance needs against your need to know as soon as possible when a failure threatens availability. System Performance Issues The primary performance impact will be related to the polling interval and the number of resources being monitored.
Troubleshooting Testing Monitor Requests Testing Monitor Requests To test that events are being sent, use the INITIAL option available with conditional notification when creating a monitoring request. This option sends notification on startup. Examine it to make sure your request is properly configured and showing up in the correct system management tool. An alternative is to use the “At each interval” notification to test that events are being sent in the correct system management tool.
Troubleshooting Testing Monitor Requests A daemon called p_client restarts all appropriate monitors using the monitor restart interval defined in /etc/opt/resmon/config. Therefore, a monitor cannot be permanently stopped or started by a human. Because the monitors are persistent, monitoring requests are kept when you install a new monitor or update an existing monitor.
Troubleshooting MIB Monitor Troubleshooting MIB Monitor Troubleshooting The MIB monitors that ship with EMS rely on various SNMP MIBs and need to have HP-UX SNMP subagents configured correctly and be running, before they can reliably report on the status of their resources. Other monitors that may be added might also need special SNMP configurations. Review the following troubleshooting hints to help ensure that your environment is set up correctly: • Refer to the standard /var/adm/syslog/syslog.log file.
Troubleshooting MIB Monitor Troubleshooting On HP-UX version 10.20, if trapdestagt is running, it should be restarted manually with the command /usr/sbin/trapdestagt. NNM or OV depends on trapdestagt to set up SNMP trap notification on managed systems. NOTE • If changes are needed to dictionary files, stop any MIB monitors that are already running. If changes are needed to snmpd.conf, stop and restart HP SNMP, following the procedure above.
Troubleshooting Steps to Obtain EMS Data to Reproduce an EMS Problem Steps to Obtain EMS Data to Reproduce an EMS Problem If you are about to reproduce an EMS problem, you should obtain a full set of EMS data that allows to get all logfiles and configuration information. Here is an example for a diskmond problem. 1. Enable debugging for EMS by issuing the command, # touch /etc/opt/resmon/debug. 2. Enable diskmond logging and debugging # vi /etc/opt/resmon/dictionary/diskmond.
Troubleshooting Steps to Obtain EMS Data to Reproduce an EMS Problem 4. Set up everything for reproduction. Backup the /etc/opt/resmon/ tree: # mkdir -p /tmp/RESMON/before # cp -Rp /etc/opt/resmon/* /tmp/RESMON/before Save logfiles (if needed): # cd /etc/opt/resmon/log # tar cvf /tmp/oldlogs.tar * # cd /var/opt/resmon/log # tar rvf /tmp/oldlogs.tar diskmond.log Clear logfiles: # for i in /etc/opt/resmon/log/*log* /var/opt/resmon/log/diskmond.log > do > rm $i > done 5. Restart EMS and reproduce the problem.
Troubleshooting Steps to Obtain EMS Data to Reproduce an EMS Problem Kill diskmond, registrar, p_client. NOTE 98 If you are not troubleshooting diskmond, make sure that you include the specific logfiles of the EMS Monitor you are looking at. Refer to the documentation of the EMS Monitor to find the location of the logfile.
Glossary A-H alert An event. A message sent to tell a user or application when that certain conditions are met, an action or state you want to know about. For example, you may want to be alerted when a disk fails or when available filesystem space falls below a certain level. asynchronous monitor A monitor that monitors resource instances (or resource class) asynchronously. It is event driven and send notifications when events occur.
Glossary LVM LVM (Logical Volume Manager) Software that manages disks in volume groups, and allows you to create logical and physical volume groupings. polling The process by which a monitor obtains the most recent status of a resource. The method is defined by the monitor when it is created. M polling interval Determines the maximum amount of elapsed time before the monitor knows about a change in resource status. MIB (Management Information Base). A document that describes objects to be managed.
Glossary volume group resource class A group of EMS resources organized into a filesystem type structure. Examples include system resources and cluster resources. See resource instance. resource dictionary A set of files that provide to the registrar a hierarchy of resources on the local system and respective resource monitors. resource instance The actual resources that can be monitored.
Glossary target 102 Glossary
A api.log file, 84 asynchronous monitors, 31 asynchronous monitors, 59 C classes, 58 cluster resources, 73 system resources, 64 client.
testing, 92 viewing, 46 monitoring system load, 64, 67 monitors updating, 30 N node status, 75 notification, 16, 29 event frequency, 32 notification comment, 39 notification option console, 37 email, 37 syslog, 37 TCP, 34 textlog, 38 UDP, 34 notification options, 32 notification protocol, 34 SNMP, 35 Notify at each interval, 29 Notify when value changes, 29 Notify when value is...
testing number of users monitoring requests, 65 textlog notification option, 38 tracing, 90 U UDP notification option, 34 UDP/IP notification, 12 updating monitors, 30 users, monitoring number on system , 65 V viewing resource descriptions, 61 viewing requests, 46 W WBEM, 21, 38 wildcard , 60 105