
HP StorageWorks Clustered File System 3.6.1 Windows Storage Server Edition administration guide (AG515 - 96007, August 2008)

Chapter 15: Performance Monitoring 196
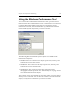
Cluster Counters
The cluster counters provided for the Microsoft Windows perfmon utility
are as follows:
•Avg % Processor Time
The percent of processor utilization for the cluster. This counter measures the
percentage of time the processor is accomplishing meaningful work (i.e., non-
idle threads). Valid values range from 0 to 100 (%). This counter can mask a
processor bottleneck on a multiprocessor system. To determine a processor
bottleneck, examine the Processor: % Processor Time for the questioned
server/node.
• Avg Processor Queue Length
The average number of threads waiting for processor time in the cluster. This
counter can mask a processor bottleneck on a multiprocessor system. To
determine a processor bottleneck, examine the System: Processor Queue
Length for the questioned server/node.
• Avg % Committed Bytes in Use
The average percent of currently committed memory (Bytes) of the Commit
Limit in the cluster. The committed memory is the physical memory currently
in use, where the same amount is reserved in the paging file should it need to
be paged out. The Commit Limit is an upper limit of the virtual memory (i.e.,
total RAM + paging file) that can be allocated on a system.
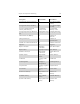
Filesystem throughput Filesystem
Throughput
Filesystem
Throughput
Filesystem I/O operations Filesystem I/O Ops Filesystem I/O Ops
% Disk usage (maximum) % Disk Usage (Max) % Disk Usage (Max)
Number of processes NA Number of
Processes
Total available disk space NA Total Available Disk
Space
Total disk space NA Total Disk Space
Description Cluster Metric Node Metric