
HP Data Protector software interaction with deduplication enabled replication


38
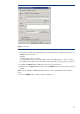
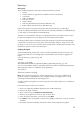
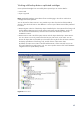
13. Arrange the fields to create a reporting table on worksheet. To arrange field labels simply
drag and drop them on the section shown in Figure 23.
Figure 23 Field arrangement
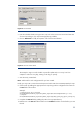
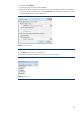
14. The wizard will create a reporting table on worksheet 2.
15. In the newly created reporting table, use the pull-down menus to select data on which you
would like to report. You are recommended to select meaningful report data.
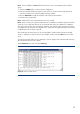
16. Select the time frame you like to report on using the Time/Date menu. Usually all reported data
is selected. This is probably not what you want. Check Select multiple items to be able to select
individual items from the lists.
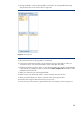
17. Make your selection for the remaining data fields.
18. Make sure you have deselected “blank”, “Import summary” items from the lists.
19. When you have finished your selection, select the entire reporting pivot table.
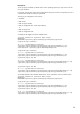
20. Insert Pie Chart using the table selected in the previous step.
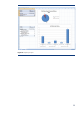
21. Fine tune the pie chart creation to get the desired view. An example is shown in Figure 24.