
Using HP Data Protector Debug Log Collector Tool "Best Practices"
Debugging basics
When HP Support is asking you to send debug data, there are several methods to generate this data
with Data Protector. This chapter will give you just an overview of the different ways of running Data
Protector in debug mode, further details can be found in the Data Protector troubleshooting guide
(chapter 11 – Before calling support). Details how to generate Inet debugs and CRS debugs are
documented in the HP Data Protector troubleshooting guide and not part of this document.
Note: Collect debugs only when the support organization requires them to resolve a technical issue.
When Data Protector runs in the debug mode, it creates debug information that consumes a large
amount of disk space.
Consult the support organization about the required detail level and environmental conditions
for debugging.
When debug files are not created like expected, the debug.log file on the problem host needs to be
checked and you need to consult your support representative.
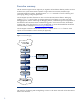
Debugging can be enabled in the listed different ways:
Debugging using the Data Protector GUI
Debugging using the trace configuration file
Debugging using the scheduler
Debugging using command line option –debug
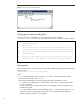
Debugging using the Data Protector GUI
In the File menu, click Preferences, and then click the Debug tab. Specify the debug options and
restart the GUI. The GUI will restart in the debug mode.
When using the JAVA GUI a GUI restart is not required, but you need to make sure to disable
debugging afterwards.
Debugging using the trace configuration file
Edit the trace configuration file, located in:
Windows Server 2008: Data_Protector_program_data\Config\server\Options\trace
Other Windows systems: Data_Protector_home\Config\server\Options\trace
UNIX systems: /etc/opt/omni/server/options/trace
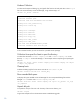
Debugging using the scheduler
To debug scheduled sessions, edit the schedule file, located in:
Windows Server 2008:
Data_Protector_program_data\Config\server\Schedules or
Data_Protector_program_data\Config\server\Barschedules
Other Windows systems:
Data_Protector_home\Config\server\Schedules or
Data_Protector_home\Config\server\Barschedules
UNIX systems: /etc/opt/omni/server/schedules or
/etc/opt/omni/server/barschedules
Add debugging parameters in the first line of the file.
Note: Before you edit the file, make a copy of it, as the changes have to be reverted when debugging
is no longer desired.
3