
HP Insight Cluster Management Utility v7.2 User Guide
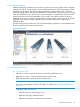
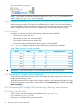
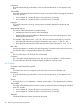
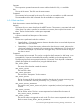
Table Of Contents
- HP Insight Cluster Management Utility v7.2
- Contents
- 1 Overview
- 2 Installing and upgrading HP Insight CMU
- 2.1 Installing HP Insight CMU
- 2.1.1 Management node hardware requirements
- 2.1.2 Disk space requirements
- 2.1.3 Support for non-HP servers
- 2.1.4 Planning for compute node installation
- 2.1.5 Firmware upgrade requirements
- 2.1.6 Configuring the local smart array card
- 2.1.7 Configuring the management cards
- 2.1.8 Configuring the BIOS
- 2.2 Preparing for installation
- 2.3 Installation procedures
- 2.4 Installing HP Insight CMU with high availability
- 2.5 Upgrading HP Insight CMU
- 2.5.1 Upgrading to v7.2 important information
- 2.5.2 Dependencies
- 2.5.3 Stopping the HP Insight CMU service
- 2.5.4 Upgrading Java Runtime Environment
- 2.5.5 Removing the previous HP Insight CMU package
- 2.5.6 Installing the HP Insight CMU v7.2 package
- 2.5.7 Installing your HP Insight CMU license
- 2.5.8 Restoring the previous HP Insight CMU configuration
- 2.5.9 Configuring the updated UP Insight CMU
- 2.5.10 Starting HP Insight CMU
- 2.5.11 Deploying the monitoring client
- 2.6 Saving the HP Insight CMU database
- 2.7 Restoring the HP Insight CMU database
- 2.1 Installing HP Insight CMU
- 3 Launching the HP Insight CMU GUI
- 4 Defining a cluster with HP Insight CMU
- 5 Provisioning a cluster with HP Insight CMU
- 5.1 Logical group management
- 5.2 Autoinstall
- 5.3 Backing up
- 5.4 Cloning
- 5.5 Node static info
- 5.6 Rescan MAC
- 5.7 HP Insight CMU image editor
- 5.8 HP Insight CMU diskless environments
- 5.8.1 Overview
- 5.8.2 The system-config-netboot diskless method
- 5.8.2.1 Operating systems supported
- 5.8.2.2 Installing the operating system on the management node and the golden node
- 5.8.2.3 Modifying the TFTP server configuration
- 5.8.2.4 Populating the HP Insight CMU database
- 5.8.2.5 Creating a diskless image
- 5.8.2.6 Creating a diskless logical group
- 5.8.2.7 Adding nodes into the logical group
- 5.8.2.8 Booting the compute nodes
- 5.8.2.9 Understanding the structure of a diskless image
- 5.8.2.10 Customizing your diskless image
- 5.8.2.11 Best practices for diskless clusters
- 5.8.3 The HP Insight CMU oneSIS diskless method
- 5.8.3.1 Operating systems supported
- 5.8.3.2 Enabling oneSIS support
- 5.8.3.3 Preparing the HP Insight CMU management node
- 5.8.3.4 Preparing the golden node
- 5.8.3.5 Capturing and customizing a oneSIS diskless image
- 5.8.3.6 Manage the writeable memory usage by the oneSIS diskless clients
- 5.8.3.7 Adding nodes and booting the diskless compute nodes
- 5.8.4 Scaling out an HP Insight CMU diskless solution with multiple NFS servers
- 6 Monitoring a cluster with HP Insight CMU
- 6.1 Installing the HP Insight CMU monitoring client
- 6.2 Deploying the monitoring client
- 6.3 Monitoring the cluster
- 6.4 Stopping HP Insight CMU monitoring
- 6.5 Customizing HP Insight CMU monitoring, alerting, and reactions
- 6.5.1 Action and alert files
- 6.5.2 Actions
- 6.5.3 Alerts
- 6.5.4 Alert reactions
- 6.5.5 Modifying the sensors, alerts, and alert reactions monitored by HP Insight CMU
- 6.5.6 Using collectl for gathering monitoring data
- 6.5.7 Monitoring GPUs and coprocessors
- 6.5.8 Monitoring HP Insight CMU alerts in HP Systems Insight Manager
- 6.5.9 Extended metric support
- 7 Managing a cluster with HP Insight CMU
- 7.1 Unprivileged user menu
- 7.2 Administrator menu
- 7.3 SSH connection
- 7.4 Management card connection
- 7.5 Virtual serial port connection
- 7.6 Shutdown
- 7.7 Power off
- 7.8 Boot
- 7.9 Reboot
- 7.10 Change UID LED status
- 7.11 Multiple windows broadcast
- 7.12 Single window pdsh
- 7.13 Parallel distributed copy (pdcp)
- 7.14 User group management
- 7.15 HP Insight firmware management
- 7.16 Customizing the GUI menu
- 7.17 HP Insight CMU CLI
- 8 Advanced topics
- 9 Support and other resources
- A Troubleshooting
- HP Insight CMU manpages
- cmu_boot(8)
- cmu_show_nodes(8)
- cmu_show_logical_groups(8)
- cmu_show_network_entities(8)
- cmu_show_user_groups(8)
- cmu_show_archived_user_groups(8)
- cmu_add_node(8)
- cmu_add_network_entity(8)
- cmu_add_logical_group(8)
- cmu_add_to_logical_group_candidates(8)
- cmu_add_user_group(8)
- cmu_add_to_user_group(8)
- cmu_change_active_logical_group(8)
- cmu_change_network_entity(8)
- cmu_del_from_logical_group_candidates(8)
- cmu_del_from_network_entity(8)
- cmu_del_archived_user_groups(8)
- cmu_del_from_user_group(8)
- cmu_del_logical_group(8)
- cmu_del_network_entity(8)
- cmu_del_node(8)
- cmu_del_snapshots(8)
- cmu_del_user_group(8)
- cmu_console(8)
- cmu_power(8)
- cmu_custom_run(8)
- cmu_clone(8)
- cmu_backup(8)
- cmu_scan_macs(8)
- cmu_rescan_mac(8)
- cmu_mod_node(8)
- cmu_monstat(8)
- cmu_image_open(8)
- cmu_image_commit(8)
- cmu_config_nvidia(8)
- cmu_config_amd(8)
- cmu_config_intel(8)
- cmu_mgt_config(8)
- cmu_firmware_mgmt(8)
- cmu_monitoring_dump(8)
- cmu_rename_archived_user_group(8)
- Glossary
- Index
6.3.7.2 Adaptive stacking
Adaptive stacking is an efficient way to monitor your cluster over a long period of time. Adaptive
stacking provides 42 minutes of data, without sacrificing the finest 5 second granularity provided
by the monitoring engine. The first 24 rings (representing 2 minutes of data, with a 5 second
granularity) progressively slide and consolidate into an intermediate ring, making room for newest
data. The intermediate ring is full when six rings are stacked in it, representing 30 seconds. Then
stacked rings slide and a new intermediate ring is created. The entire 42 minutes of history is
displayed as 24 rings of 5 seconds (representing 2 minutes of data), and 80 rings of 30 seconds
(representing 40 minutes of data). Stacked rings are displayed darker than single rings to
differentiate them.
The following figure shows Time View with 32 nodes displayed, including two color labeled nodes.
Stacked rings are visible at the end of the tube.
Figure 38 Time view
6.3.7.3 Bindings and options
6.3.7.3.1 Mouse control
• Left-click on a node – Mark the node from a set of four predefined colors
• Right-click on a node – Open the interactive menu for this node
• Right-click elsewhere – Open the metrics selection menu
NOTE:
Time View cannot display more than 10 metrics. For details, see “Technical dependencies”
(page 94).
• Navigating within the 3D scene
Left-click and drag – Translate the scene◦
◦ Right-click and drag – Rotate the scene
◦ Rotate the mousewheel – Rotate tubes on themselves
6.3 Monitoring the cluster 93