
Users Guide - Platform Instrumentation Control

Intel Platform Instrumentation Control (PIC) Console User's Guide
19
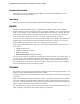
Temperature
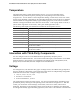
The temperature dialog contains all temperature sensors. You can see individual sensor
information in the presentation pane by selecting the corresponding sensor node from the
navigation tree. You can monitor current temperature readings, current status, sensor error counts,
and set sensor thresholds. Depending on the individual temperature sensor and the server platform,
some thresholds are unsupported and they appear disabled, grayed out, in the control. The status
indicator in the upper left-hand corner shows the current status: a red stop sign means “Critical,” a
yellow caution sign means “Non-Critical,” and a green traffic light means “OK.”
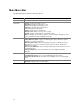
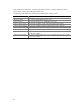
The following table displays the information available for the temperature sensors.
Item Description
Maximum Reading The highest reading supported on this sensor.
Minimum Reading The lowest reading supported on this sensor.
Sensor Accuracy The sensor’s accuracy in +/- hundredths of a percent.
Sensor Tolerance (plus) The amount of variation over the actual value that can be reported.
Sensor Tolerance (minus) The amount of variation under the actual value that can be reported.
Sensor Resolution The smallest unit of measurement reported by the sensor.
Nominal Reading The expected normal reading for this sensor.
Lowest Normal Reading The lowest normal reading of this sensor. Readings below this value indicate
an abnormal condition.
Highest Normal Reading The highest normal reading of this sensor. Readings above this value indicate
an abnormal condition.
Interaction with Third-Party Components
You can configure event actions for DMI indications generated by third-party Server
Instrumentation installed with PIC. You can also monitor third-party instrumentation via the DMI
Explorer Interface. PIC supports event configuration for Adaptec SCSI, LSI (Symbios) SCSI,
QLogic SCSI, Promise IDE, and LAN Adapter Server Instrumentation.
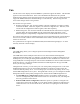
Voltage
In a managed server, PIC monitors many types of voltage sensors; the number and type depend on
the server hardware configuration. Each monitored voltage sensor has independently configurable
thresholds and event actions. Example voltage sensors are:
• 12V, 5V, 3.5V, 3.3V, -5V, -12V
• Processors 1.5V and 2.5V
• SCSI A Termination 1, 2, and 3
The voltage dialog contains all voltage sensors. You can see individual sensor information in the
presentation pane by selecting the corresponding sensor node from the navigation tree. With this
control, you can monitor current readings, current status, sensor error counts, and set sensor
thresholds. Depending on the individual voltage sensor and the server platform, some thresholds
are unsupported and they appear disabled (grayed out) in the control. The indicator in the left-hand