
Brocade Network Advisor SAN User Manual v12.0.0 (53-1002696-01, April 2013)
Brocade Network Advisor SAN User Manual 927
53-1002696-01
Bottleneck detection
29
5. Click the right arrow.
The bottleneck parameters are applied to the selected items.
6. Click OK or Apply to save your changes.
Displaying bottleneck statistics
You can display a graph of bottleneck statistics for up to 32 ports at one time.
You can display a graph showing the history of bottleneck conditions, for up to the last 150
minutes.
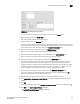
1. Select Monitor > Performance > Bottleneck Graph.
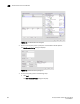
The Bottleneck Graph Port Selector dialog box displays with bottlenecked ports shown in the
Available list.
2. (Optional) Select All Ports from the Show list to display all ports in the Available list.
3. Select one or more ports for which you want to display bottleneck statistics and click the right
arrow to move them to the Selected list.
You can select up to 32 ports.
You can select a por t on the Available list or Selected list to find and highlight the port on the
alternate list.
4. Click OK.
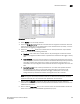
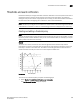
The Bottleneck Graph dialog box displays, showing bottleneck statistics for the selected ports.
This dialog box has several options for displaying the data:
• Change the display interval and the display range.
The display range cannot exceed the 30 times the display interval. Note that the display
interval is in seconds and the display range is in minutes. So if the display interval is 10
(seconds), the display range cannot be greater than (5 minutes). (10 seconds X 30 = 300
seconds = 5 minutes)
• Click Refresh to update the displayed data with fresh data.
If you change the display interval or display range, you must click Refresh for the changes
to take effect.
• Display realtime and historical performance graphs.
• Select a bottlenecked F_ or FL_Port and click Show Affected Devices to see the hosts and
targets that might be affected by the bottleneck.