
Brocade Network Advisor SAN User Manual v12.0.0 (53-1002696-01, April 2013)
Brocade Network Advisor SAN User Manual 905
53-1002696-01
SAN real-time performance data
29
Filtering real-time performance data
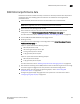
To filter real-time performance data from the Real Time Performance Graphs dialog box, complete
the following steps.
1. Open the Real Time Performance Graphs dialog box.
For step-by-step instructions, refer to “Generating a real-time performance graph” on
page 903. The Real Time Performance Graphs dialog box displays.
2. Select how the data is measured, in received frames, transmitted frames, or CRC errors.
For a list of possible performance measures, refer to “SAN Performance measures” on
page 897“.
3. To select more than one measure, click the Additional Measures expand arrows and select the
check box for each additional measure. If area is not shown, click the down arrow to display.
For a list of possible performance measures, refer to “SAN Performance measures” on
page 897“.
4. (Optional) Enter a value (percentage) in the Reference Line field to set a reference for the
transmit and receive utilization.
Note that this field is only available when you select Tx % Utilization or Rx % Utilization from the
Measures list.
5. Select how detailed the data will display from the Granularity list. Options are in increments of
10 seconds, 15 seconds, 20 seconds, 25 seconds, 30 seconds, 45 seconds, or 1 minute.
6. Select Plot Events to display advanced monitoring service (AMS) violation events received
during the chart time range and master log events logged on the same product as the measure
being plotted.
7. Move t h e Row Height slider to the left to make the row height smaller or to the right to make it
bigger.
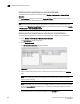
8. Select the Display tabular data only check box to only show text with no graphs or icons.
The Source and Destination icons and the Graph column do not display
9. Click Apply.
The selected data automatically displays in the Real Time Performance Graphs dialog box.
10. Click the close button (X) to close the Real Time Performance Graphs dialog box.
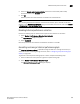
Graph display
The columns in the graphical portion of the Real Time Performance Graphs dialog box display the
following information:
• Source Fabric - The source fabric being monitored.
• Source - The source device being monitored.
• Source Port - The source port being monitored.
• Tunnel ID - The ID of the FCIP tunnel being monitored.
• Destination Fabric - The destination fabric.
• Description. Description of the FCIP tunnel.