
Brocade Network Advisor SAN User Manual v12.0.0 (53-1002696-01, April 2013)

244 Brocade Network Advisor SAN User Manual
53-1002696-01
SAN tab overview
9
Connectivity Map functions
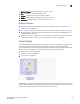
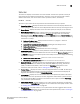
• Two-way selection — When you select an icon on the Topology Map, that device is highlighted in
the Product List and vice versa.
• Device double-click — Double-click a device to launch Web Tools for the selected device.
• Zoom In/Zoom Out — Click the appropriate button to zoom in or out on the Topology Map.
• Tool tips — Mouse over a device or connection to view information.
• Right-click menus — Right-click a device to view the menu. For a list of right-click menus, refer
to “SAN shortcut menus” on page 1071.
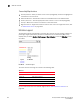
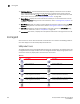
Utilization Legend
The Utilization Legend, which displays in the lower right corner of the main window, indicates the
percentage ranges represented by the colored, dashed lines on the Connectivity Map. It only
displays when you select Monitor > Performance > View Utilization or click the Utilization icon on
the toolbar.
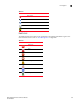
FIGURE 89 Utilization Legend
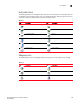
The colors and their meanings are outlined in the following table.
For more information about the utilization legend, refer to “SAN Connection utilization” on
page 934.
TABLE 29
Line Color Utilization Defaults
Red line 80% to 100% utilization
Yellow line 40% to 80% utilization
Blue line 1% to 40% utilization
Gray line 0% to 1% utilization
Black line Utilization disabled