
Brocade Network Advisor SAN User Manual v12.0.0 (53-1002696-01, April 2013)

Brocade Network Advisor SAN User Manual 219
53-1002696-01
Performance Dashboard monitors
8
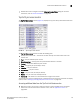
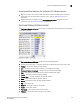
• Status — The product status (for example, Reachable).
• Tag — The product tag.
• Serial # — The serial number of the product.
• Model — The product model.
• Port Count — The number of ports on the product.
• Firmware — The firmware level running on the product.
• Location — The location of the product.
• Contact — A contact name for the product.
• Refreshed — The refresh time and selected time range for the monitor.
To customize the monitor to display data by a selected time frame as well as customize the display
options, refer to “Editing a preconfigured performance monitor” on page 220.
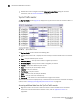
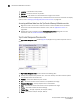
Accessing additional data from the Top Product Response Time monitor
• Right-click a row in the monitor to access the shortcut menu available for the associated
device. For more information about shortcut menus, refer to “Application menus” on
page 1061.
• Double-click a row to navigate to the IP Historical Graphs/Tables dialog box. For more
information, refer to “Performance Data” on page 895.
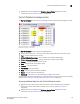
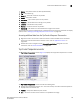
Top Product Temperature monitor
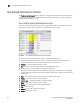
The Top Product Temperature monitor (Figure 79) displays the top product temperature in a table.
FIGURE 79 Top Product Temperature monitor
The Top Product Temperature monitor includes the following data:
• Severity icon/temperature/monitor title — The worst severity of the data and the temperature
displays next to the monitor title.
• Product — The product affected by this monitor.
• Min — The minimum value of the measure in the specified time range.