
Brocade Network Advisor SAN User Manual v12.0.0 (53-1002696-01, April 2013)

Brocade Network Advisor SAN User Manual 195
53-1002696-01
Dashboard widgets
8
Bottlenecked Ports widget
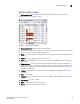
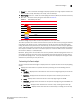
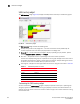
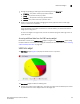
The Bottlenecked Ports widget (Figure 59) displays the bottlenecked port violations for the
specified fabric and time range in a table.
FIGURE 59 Bottlenecked Ports widget
The Bottlenecked Ports widget includes the following data:
• Severity icon/violation count/widget title — The color of the worst severity and the total number
of ports in violation displays before the widget title.
• Show list — A list of available managed fabrics with at least one product running Fabric OS 6.4
or later.
• Range — The time range from last hour to last month.
• Port — The port identifier, such as port name, number, address, WWN, user port number, or
zone alias.
• Violation Count — The number of bottleneck violations for the port during the selected time
range. This is based on bottleneck configuration. Each trap or alert sent by the switch and the
Management application counts as one violation. For more information, refer to “Bottleneck
detection” on page 922.
• Product — The product label, such as product name, IP address, node WWN, domain ID, or
zone alias.
• Type — The port type.
• Identifier — The port identifier, such as port name, number, address, WWN, user port number,
or zone alias.
• Port Number — The port number.
• State — Whether the port is online or offline.
• Status — Whether the port is online or offline.