
Brocade Network Advisor SAN User Manual v12.0.0 (53-1002696-01, April 2013)
Brocade Network Advisor SAN User Manual 941
53-1002696-01
SAN Connection utilization
29
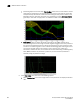
a. (Historical graphs and monitors only) Select the granularity of the data points to
display on the graph from the Granularity list. Options are Minimum interval, 30
minutes, 2 hours, or 1 day.
The granularity varies depending on the configuration on the Server Management
Console, Performance Data Aging tab. For more information, refer to “Defining the
performance data aging interval” on page 309.
b. The graph will not update dynamically if the granularity is 30 Minutes, 2 Hours, or 1
day. To update SAN graphs, click Apply. Select the duration of time for data display on
the graph from Select list.
Real time options are incremental from the last 30 minutes to the last 6 hours.
Historical options are incremental from the last 30 minutes to the last 24 hours.
• (Historical graphs and monitors only) Select Absolute time to get a snapshot of data from a
specific time range and complete the following steps.
a. Select the start date from the Start Date list.
b. Select the start time (1 through 12) from the first Start Time list.
c. Select AM or PM from the second Start Time list.
d. Select the end date from the End Date list.
e. Select the end time (1 through 12) from the first End Time list.
f. Select AM or PM from the second End Time list.
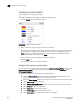
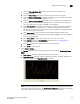
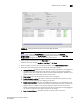
6. Include items in the graph by selecting the Display check box for each item in the Items
Available for Display table.
7. Set the scale factor for each item by entering a value (integer between -2147483648 and
2147483647) in the Scaling Factor column for each item in the Items Available for Display
table.
8. Click OK on the Graph Options dialog box.