
Brocade Network Advisor SAN User Manual v12.0.0 (53-1002696-01, April 2013)


Brocade Network Advisor SAN User Manual 937
53-1002696-01
SAN Connection utilization
29
• Select the Use Logarithmic Axis check box to present data on a logarithmic or
non-logarithmic axis.
• Select the Show Values check box to annotate data point values in the graph.
• Select the Enable Auto Scrolling check box to automatically jump to display the new data
when new data is collected while the graph is in view.
• Select the Enable Transition Effect check box to automatically adjusts the range on the
vertical axis so that all the data are contained within the view area when you drag the
chart into a different time range on the SNMP monitoring graph.
• Select Plot Min/Max to plot minimum and maximum values along with the average data
point This option is not available if minimum interval granularity (5 minutes for SAN
historical graph) is selected. The width of the color band displayed on the graph indicates
the variation during the time period.
• Select Show Events to display advanced monitoring service (AMS) violation events
received during the chart time range and master log events logged on the same product as
the measure being plotted.
• Select Chart Styles to display data as a line chart, area chart, or bar chart.
• Select Options to launch the Graph Options dialog box. Refer to “Configuring graph
options” on page 938 for more information.
• Select Export to export to a spreadsheet (.csv) or an image (.png).
• Select Print to print the graph.
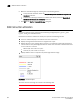
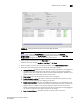
2. Select Server > Options.
The Options dialog box displays. The following options are available for Performance Graph
Styles:
• Color Scheme - Change the graph background to white or black.
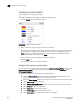
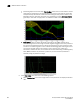
• Show Data Points check box — Select to display data points on the graph. Following is an
example of a graph when Show data points is selected.
NOTE
Although these settings will apply to all performance graphics in the Management application,
the change will not reflect instantly on the Performance Dashboard graph monitor that displays
these graphs. Rather it will be updated the next time the monitor is launched.