
Brocade Network Advisor SAN User Manual v12.0.0 (53-1002696-01, April 2013)

936 Brocade Network Advisor SAN User Manual
53-1002696-01
SAN Connection utilization
29
Changing connection utilization
You can change the utilization percentages.
To change the utilization percentages, complete the following steps.
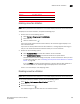
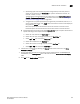
1. Click the change link in the utilization legend.
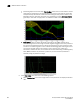
FIGURE 408 Utilization Legend in edit mode
2. Enter or select the end percentage you want for the blue line.
When you make a change to the end percentage of a utilization line, you also change the start
percentage for the utilization line immediately above the one you changed when you click
apply. For example, if you change the blue line end percentage to 60 the yellow line start
percentage changes to 60 when you click apply.
3. Enter or select the end percentage you want for the yellow line.
4. Click the apply link.
The new values appear in the utilization legend.
Configuring the performance graph display
Use the procedure to configure the graph display for the Real Time Graphs/Tables dialog box and
Historical Graphs/Tables dialog box as well as time series monitors on the Dashboard tab or
Performance Dashboard.
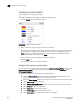
1. Right-click the graph and select one of the following options.
• Select the Show Controls check box to show or hide additional display options on the
graph (refer to step 3 through step 9 for more information).
• Select the Show Legend check box to show or hide the measurements beneath the graph.
• Select Clear Graph to clear the graph.
• Select Deleted Selected Measures to delete the selected measures from performance.
• Select Zoom In to zoom in on the graph.
• Select Zoom Out to zoom out on the graph.
• Select Fit in window to fit the graph in the window.
• Select Go to Latest to go to the latest data point on the graph.