
Brocade Network Advisor SAN User Manual v12.0.0 (53-1002696-01, April 2013)

Brocade Network Advisor SAN User Manual 911
53-1002696-01
SAN Historical performance data
29
• Raw samples for last 1 day
• 30 minutes granularity for last 3 days
• 2 hour granularity for last 30 days
• 1 day granularity for last 2 years
Option 2—2 years data with the following samples:
• Raw samples for last 8 days
• 1 day granularity for last 2 years
NOTE
The graph will not update dynamically if the granularity is 30 Minutes, 2 Hours, or 1 day. To
update, click Apply. The graph will update dynamically when 5 Minutes is selected.
For more information, refer to “Defining the performance data aging interval” on
page 309.
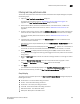
e. Select the measure by which you want to gather performance data from the Measures list.
To select more than one measure, click the Additional Measures expand arrows and select
the check box for each additional measure.
f. If selecting Tx % Utilization or Rx % Utilization from the Measures list, enter a percentage in
Reference Line Value.
g. Select Plot Events to plot advanced monitoring service (AMS) violation events received
during the chart time range and master log events logged on the same product as the
measure being plotted.
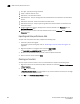
h. Move the Row Height slider to the left to make the row height smaller or to the right to
make it bigger.
i. Select the Display tabular data only check box at the bottom of the graph to only show text
with no graphs or icons.
The Source and Destination icons and the Graph column do not display
j. Click OK.
k. Click Apply.
The selected graph automatically displays in the Historical Performance Graph dialog box.
To save a filtered graph, refer to “Generating and saving a historical performance graph”
on page 909.
To delete user-defined graph, refer to “Deleting a favorite graph configuration” on
page 914.
To configure graph display, right-click in the graph and select desired options. For details
on these options, refer to “Configuring the graph display” on page 912.
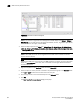
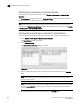
4. Enter a name for the configuration in the Favorites Name field.
5. Save this configuration by selecting Save.
The Save Favorites dialog box displays. This enables you to save the selected configuration so
that you can use it to generate the same type of report at a later date.
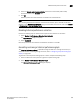
6. Click the close button (X) to close the HIstorical Performance Graph dialog box.