
Brocade Network Advisor SAN User Manual v12.0.0 (53-1002696-01, April 2013)

Brocade Network Advisor SAN User Manual 909
53-1002696-01
SAN Historical performance data
29
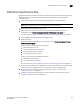
5. Select the Include newly discovered fabrics check box to automatically add all newly
discovered fabrics to the Selected table.
6. Click OK.
Historical performance data collection is enabled for all selected fabrics.
NOTE
After, enabling historical data collection, information for switches, ports, and FCIP tunnels also
displays in the IP Historical Graph/Tables dialog box. If available, click the IP tab, then select Monitor
> Performance > Historical Graphs/Tables.
Disabling historical performance collection
Perform the following steps to disable historical performance collection on all fabrics:
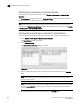
1. Select Monitor > Performance > Historical Data Collection
The Fabric Selector dialog box displays.
2. Select Disable All.
Historical performance data collection is disabled for all fabrics in the SAN.
Generating and saving a historical performance graph
The Historical Performance Graph is available through the SAN tab or through the IP tab if you
select SAN devices. If selecting through the IP tab, refer to “Configuring the performance graph
display” on page 936.
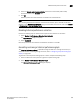
To generate a historical performance graph for a device, complete the following steps.
1. Select the device for which you want to generate a performance graph.
2. Select Monitor > Performance > Historical Graph.
The Historical Performance Graph dialog box displays.