
Brocade Network Advisor SAN User Manual v12.0.0 (53-1002696-01, April 2013)

904 Brocade Network Advisor SAN User Manual
53-1002696-01
SAN real-time performance data
29
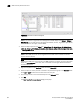
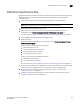
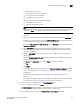
FIGURE 393 Realtime Port Selector dialog box
NOTE
You can set columns in right side of the dialog box for FICON display using Server > Options >
SAN DIsplay. The first eight columns will display FC Address, Serial #, Tag, Product Type, Model,
Vendor, Port Name, Port Type, and Port WWN.
3. Select the object type from the Show list (Switch Ports - FC, Switch Ports - GE, Switch Ports -
10GE, ISL Ports, E_Port Trunks, EE Monitors, FCIP Tunnels, Device Ports, Managed HBA Ports,
or Managed CNA Ports) by which you want to graph performance.
NOTE
Devices with 10GE ports must be running Fabric OS 6.4.1ltd or later to obtain the correct
TE port statistics (TX/RX).
NOTE
Devices with 10GE ports must have the rmon MIB enabled on the switch. For more information
about the rmon collection command, refer to the Fabric OS Converged Enhanced Ethernet
Command Reference.
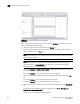
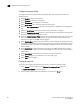
4. Right-click anywhere in the Available table and select Expand All.
5. Select the ports or trunks you want to include in the performance graph in the Available table.
Press Ctrl or Shift and then click to select more than one port.
6. Click the right arrow to move the selected ports to the Selected table.
7. Cl ic k OK.
The Real Time Performance Graphs dialog box displays.