
Brocade Network Advisor SAN User Manual v12.0.0 (53-1002696-01, April 2013)
232 Brocade Network Advisor SAN User Manual
53-1002696-01
User-defined performance monitors
8
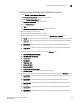
9. (Top N, Bottom N, and Distribution monitors only) Configure the monitor to show only values
greater than or less than a specified value by completing the following steps.
a. Select the Show values check box.
b. Select greater than or less than from the list.
c. Enter a value in the field.
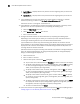
10. (Time series monitors only) Add targets for the monitor by clicking Add and completing the
steps in “Adding targets to a user-defined performance monitor” on page 229.
11. (Time series only) Remove targets from the monitor by selecting one or more targets in the
Targets list and clicking Remove.
12. Click OK on the Add Performance Dashboard Monitor dialog box.
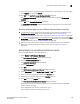
The Customize Dashboard dialog box displays with the new monitor in the Performance
Monitors list.
13. Click OK on the Customize Dashboard dialog box.
The Performance Dashboard dialog box displays with the new monitors at the bottom of the
dashboard.
Accessing additional data from user-defined port performance monitors
• In a Distribution monitor, double-click a percentage range to navigate to the Measure_Type
Distribution Data Details dialog box. For more information, refer to “Viewing product
distribution data details” on page 232 or “Viewing port distribution data details” on page 233.
• Right-click a row in the monitor to access the shortcut menu available for the associated
device. For more information about shortcut menus, refer to “Application menus” on
page 1061.
• In a Top N or Bottom N monitor, double-click a row or right-click a row and select Show
Graph/Table to navigate to the Custom: Historical Performance Graph dialog box for the
selected measures. For more information, refer to “Generating and saving a historical
performance graph” on page 909.
• In a Top N or Bottom N C3 Discards TX TO and C3 Discards RX TO monitors, right-click an
FC-port row (Fabric OS device running 7.1.0 or later) and select Discarded Frames to navigate
to the Discarded Frames dialog box. For more information, refer to “Viewing discarded frames
from a port” on page 352.
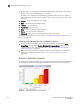
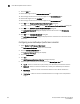
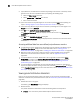
Viewing product distribution data details
Each bar on the product distribution graph maps directly to one of the five percentage ranges
defined for the distribution performance monitor (refer to “Distribution performance monitors” on
page 224).
1. Double-click a bar in the graph.
The Monitor_Title Data Details dialog box displays.
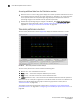
2. Review the data.
The product distribution data details include the following fields and components:
• Product — The name of the product affected by the selected measure.