
Brocade Network Advisor SAN User Manual v12.0.0 (53-1002696-01, April 2013)
Brocade Network Advisor SAN User Manual 231
53-1002696-01
User-defined performance monitors
8
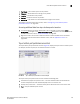
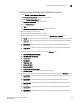
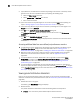
6. Select the port measure for the monitor in the Measure area:
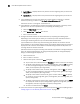
7. Display data for a specific duration by selecting one of the following from the Duration options:
• Last 30 Min — Displays data for the previous half hour beginning when you launch the
dashboard.
• Last 60 Min — Displays data for the previous hour beginning when you launch the
dashboard.
• Last 120 Min — Displays data for the previous 2 hours beginning when you launch the
dashboard.
• Last 4 Hours — Displays data for the previous 4 hours beginning when you launch the
dashboard.
• Last 8 Hours — Displays data for the previous 8 hours beginning when you launch the
dashboard.
• Last 12 Hours — Displays data for the previous 12 hours beginning when you launch the
dashboard.
• Last 24 Hours — Displays data for the previous 24 hours beginning when you launch the
dashboard.
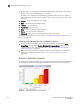
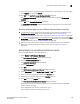
8. (Top N and Bottom N monitors only) Select the number of ports to include in a selected
measure by entering a number in the For Top N, Bottom N Monitors, N= text box.
Valid values are from 1 through 25. The default is 10.
Common
• Port Utilization Percentage
• Traffic
• CRC Errors
FC
• Link Resets
• Signal Losses
• Sync Losses
• Link Failures
• Sequence Errors
• Invalid Transmissions
• C3 Discards
• C3 Discards TX TO
• C3 Discards RX TO
• C3 Discards Unreachable
• C3 Discards Other
• Encode Error Out
• SFP Power
• SFP Voltage
• SFP Current
• SFP Temperature
FCIP
• Compression Ratio
• Latency
• Dropped Packets
• Link Retransmits
• Timeout Retransmits
• Fast Retransmits
• Duplicate Ack Received
• Window Size RTT
• TCP Out of Order Segments
• Slow Start Status
IP
• Errors
• Discards
• Receive EOF
• Underflow Errors
• Overflow Errors
• Alignment Errors
• Runtime Errors
• Too Long Errors
Wireless
• Dropped Events
• MAC Errors
• Back Packets Received
• Tx Errors