
Brocade Network Advisor SAN User Manual v12.0.0 (53-1002696-01, April 2013)
Brocade Network Advisor SAN User Manual 229
53-1002696-01
User-defined performance monitors
8
13. (Time series monitors only) Remove targets from the monitor by selecting one or more targets
in the Targets list and clicking Remove.
14. Click OK on the Add Performance Dashboard Monitor dialog box.
The Customize Dashboard dialog box displays with the new monitor in the Performance
Monitors list.
15. Click OK on the Customize Dashboard dialog box.
The Performance Dashboard dialog box displays with the new monitors at the bottom of the
dashboard.
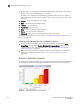
Accessing additional data from user-defined product performance monitors
• In a Distribution monitor, double-click a percentage range to navigate to the Measure_Type
Distribution Data Details dialog box. For more information, refer to “Viewing product
distribution data details” on page 232 or “Viewing port distribution data details” on page 233.
• In a Top N or Bottom N product monitor, double-click a row or right-click a row and select Show
Graph/Table to navigate to the Historical Graphs/Tables dialog box for the selected measures.
For more information, refer to “Performance Data” on page 895.
• Right-click a row in the monitor to access the shortcut menu available for the associated
device. For more information about shortcut menus, refer to “Application menus” on
page 1061.
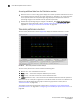
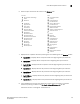
Adding targets to a user-defined performance monitor
You can only add targets for Time Series monitors.
1. Select Monitor > Performance > Dashboard.
The Performance Dashboard displays in a new window.
2. Click the Customize Dashboard icon.
The Customize Dashboard dialog box displays.
3. Click the Performance tab.
4. Click Add.
The Add Performance Dashboard Monitor dialog box displays.
5. Select Time Series from the Monitor Type - Product or Port area.
6. Select the port measure for the monitor in the Measure area
7. Display data for a specific duration from the Duration options.
8. Click Add beneath the Targets table.
The Performance Dashboard Monitor Targets dialog box displays.
Depending on the type of measure you select, you can add SAN products/portsand FCIP
tunnels to the list of targets.
If you selected SAN port measure, continue with step 9.
If you selected a FC IP port measure, go to step 12.