
Brocade Network Advisor SAN User Manual v12.0.0 (53-1002696-01, April 2013)
Brocade Network Advisor SAN User Manual 227
53-1002696-01
User-defined performance monitors
8
Configuring a user-defined product performance monitor
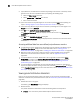
1. Select Monitor > Performance > Dashboard.
The Performance Dashboard displays in a new window.
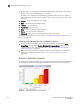
2. Click the Customize Dashboard icon.
The Customize Dashboard dialog box displays.
3. Click the Performance tab.
4. Click Add.
The Add Performance Dashboard Monitor dialog box displays.
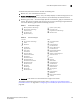
5. Enter a unique title for the monitor.
The title can be up to 256 characters in length.
6. Select the type of monitor you are creating from the Monitor Type - Products area:
• Top N — Select to monitor the top N (number) products affected by the selected measure.
• Bottom N — Select to monitor the bottom N (number) products affected by the selected
measure.
• Distribution — Select to monitor the selected measure for five defined distribution
percentages.
• Time Series — Select to monitor a selected measure for a range of time and specified
target.
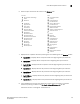
7. Select the product measure for the monitor in the Measure area:
• Memory Utilization Percentage
• CPU Utilization Percentage
• Temperature
• Fan Speed
• Response Time
• System Up Time
• Ports Not In Use
• Ping Packet Loss Percentage
• AP Client Count (not available for Time Series monitors)
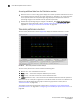
8. Display data for a specific duration by selecting one of the following from the Duration options:
• Last 30 Min — Displays data for the previous half hour beginning when you launch the
dashboard.
• Last 60 Min — Displays data for the previous hour beginning when you launch the
dashboard.
• Last 120 Min — Displays data for the previous 2 hours beginning when you launch the
dashboard.
• Last 4 Hours — Displays data for the previous 4 hours beginning when you launch the
dashboard.
• Last 8 Hours — Displays data for the previous 8 hours beginning when you launch the
dashboard.