
Brocade Network Advisor SAN User Manual v12.0.0 (53-1002696-01, April 2013)
Brocade Network Advisor SAN User Manual 225
53-1002696-01
User-defined performance monitors
8
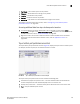
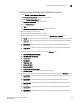
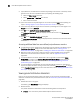
The distribution performance monitor includes the following data:
• Monitor title — The user-defined monitor title.
• Number of Products/Ports (y-axis) — The y-axis always displays a numbered range (zero to the
maximum number of objects) for the products or ports affected by the selected measure.
• Measure_Type (x-axis) — The x-axis display depends on the Measure_Type you selected for this
monitor. Each bar on the graph maps directly to one of the five percentage ranges defined for
the monitor. Measure_Type includes the following measures:
• Refreshed — The refresh time and selected time range for the monitor.
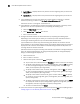
To configure a distribution performance monitor, refer to “Configuring a user-defined product
performance monitor” on page 227 or “Configuring a user-defined port performance monitor” on
page 230.
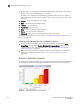
TABLE 27 Product measures types
• Memory Utilization Percentage
• CPU Utilization Percentage
• Temperature (C)
• Fan Speed (rpm)
• Response Time (s)
• System Up Time (days)
• Ports Not In Use
• Ping Packet Loss Percentage
• AP Client Count
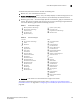
TABLE 28 Port measures types
Common
• Port Utilization Percentage
• Traffic
• CRC Errors
FC
• Link Resets
• Signal Losses
• Sync Losses
• Link Failures
• Sequence Errors
• Invalid Transmissions
• C3 Discards
• C3 Discards TX TO
• C3 Discards RX TO
• C3 Discards Unreachable
• C3 Discards Other
• Encode Error Out
• SFP Power
• SFP Voltage
• SFP Current
• SFP Temperature
FCIP
• Compression Ratio
• Latency
• Dropped Packets
• Link Retransmits
• Timeout Retransmits
• Fast Retransmits
• Duplicate Ack Received
• Window Size RTT
• TCP Out of Order Segments
• Slow Start Status
IP
• Errors
• Discards
• Receive EOF
• Underflow Errors
• Overflow Errors
• Alignment Errors
• Runtime Errors
• Too Long Errors
Wireless
• Dropped Events
• MAC Errors
• Back Packets Received
• Tx Errors