
Brocade Network Advisor SAN User Manual v12.0.0 (53-1002696-01, April 2013)

224 Brocade Network Advisor SAN User Manual
53-1002696-01
User-defined performance monitors
8
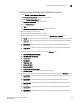
• Measure_Type — The percentage bar of the selected measure. Depending on the selected
measure, more than one Measure_Type may display.
By default, ports display sorted by the Measure_Type value (Top ports sort from highest to
lowest and bottom ports sort lowest to highest). Click a column head to sort the columns by
that value.
• Product — The product affected by this monitor.
• Type — The type of port (for example, U-Port).
• Identifier — The port identifier.
• Port Number— The port number.
• State — The port state (for example, Enabled).
• Status — The port status (for example, Up).
• Refreshed — The refresh time and selected time range for the monitor.
To configure a port performance monitor, refer to “Configuring a user-defined port performance
monitor” on page 230.
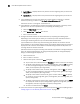
Accessing additional data from top or bottom port monitors
• In a Top N or Bottom N monitor, double-click a row or right-click a row and select Show
Graph/Table to navigate to the Custom: Historical Performance Graph dialog box for the
selected measures. For more information, refer to “Generating and saving a historical
performance graph” on page 909.
• Right-click a row in the monitor to access the shortcut menu available for the associated
device. For more information about shortcut menus, refer to “Application menus” on
page 1061.
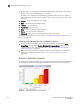
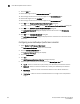
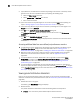
Distribution performance monitors
The distribution performance monitor (Figure 82) displays the distribution (number) of products or
ports for each of the five percentage ranges defined for the selected measure in a bar graph.
FIGURE 82 Distribution performance monitor example