
Brocade Network Advisor SAN User Manual v12.0.0 (53-1002696-01, April 2013)

Brocade Network Advisor SAN User Manual 223
53-1002696-01
User-defined performance monitors
8
• Port Count — The number of ports on the product.
• Firmware — The firmware level running on the product.
• Location — The location of the product.
• Contact — A contact name for the product.
• Refreshed — The refresh time and selected time range for the monitor.
To configure a product performance monitor, refer to “Configuring a user-defined product
performance monitor” on page 227.
Accessing additional data from top or bottom product monitors
• In a Top N or Bottom N monitor, double-click a row or right-click a row and select Show
Graph/Table to navigate to the Historical Graphs/Tables dialog box for the selected measures.
For more information, refer to “Performance Data” on page 895.
• Right-click a row in the monitor to access the shortcut menu available for the associated
device. For more information about shortcut menus, refer to “Application menus” on
page 1061.
Top or bottom port performance monitors
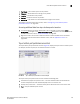
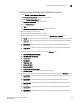
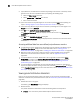
The top or bottom port performance monitors (Figure 81) display the top or bottom number of ports
(for example, bottom 10 ports) for the selected measure in a table.
FIGURE 81 Top or bottom port performance monitor example
The top or bottom port performance monitor includes the following data:
• Threshold icon/object count/monitor title — The color associated with the threshold and
number of objects within that threshold displays next to the monitor title.
• Severity icon/monitor title — The worst severity of the data shown next to the monitor title.
• Port — The port affected by this monitor.