
Brocade Network Advisor SAN User Manual v12.0.0 (53-1002696-01, April 2013)

222 Brocade Network Advisor SAN User Manual
53-1002696-01
User-defined performance monitors
8
User-defined performance monitors
The Performance Dashboard makes it easy for you to customize performance monitors specific to
your needs. You can define up to 100 performance monitors; however, you can only display up to
30 performance monitors at a time.
Top or bottom product performance monitors
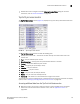
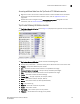
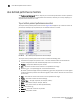
The top or bottom product performance monitors (Figure 80) display the top or bottom number of
products (for example, top 10 products) for the selected measure in a table.
FIGURE 80 Top or bottom product performance monitor example
The top or bottom product performance monitor includes the following data:
• Threshold icon/object count/monitor title — The color associated with the threshold and
number of objects within that threshold displays next to the monitor title.
• Product — The product affected by this monitor.
• Min — The minimum value of the measure in the specified time range.
• Measure_Type — The percentage bar of the selected measure.
By default, products display sorted by the Measure_Type value (Top products sort from highest
to lowest and bottom products sort lowest to highest). Click a column head to sort the columns
by that value.
• Max — The maximum value of the measure in the specified time range.
• Fabric — The fabric to which the device belongs.
• Product Type — The type of product (for example, switch).
• State — The product state (for example, Offline).
• Status — The product status (for example, Reachable).
• Tag — The product tag.
• Serial # — The serial number of the product.
• Model — The product model.