
Brocade Network Advisor SAN User Manual v12.0.0 (53-1002696-01, April 2013)

Brocade Network Advisor SAN User Manual 217
53-1002696-01
Performance Dashboard monitors
8
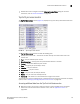
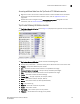
Accessing additional data from the Top Product CPU Utilization monitor
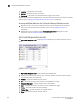
• Right-click a row in the monitor to access the shortcut menu available for the associated
device. For more information about shortcut menus, refer to “Application menus” on
page 1061.
• Double-click a row to navigate to the IP Historical Graphs/Tables dialog box. For more
information, refer to “Performance Data” on page 895.
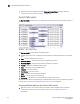
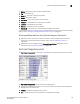
Top Product Memory Utilization monitor
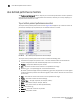
The Top Product Memory Utilization monitor (Figure 77) displays the top product memory utilization
percentages in a table.
FIGURE 77 Top Product Memory Utilization monitor
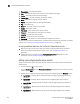
The Top Product Memory Utilization monitor includes the following data:
• Severity icon/monitor title — The worst severity of the data shown next to the monitor title.
• Product — The product affected by this monitor.
• Min — The minimum value of the measure in the specified time range.
• Memory Utilization Percentage — The top memory utilization percentages.
• Max — The maximum value of the measure in the specified time range.
• Fabric — The fabric to which the device belongs.
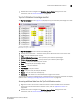
• Product Type — The type of product (for example, switch).
• State — The product state (for example, Offline).
• Status — The product status (for example, Reachable).
• Tag — The product tag.
• Serial # — The serial number of the product.
• Model — The product model.
• Port Count — The number of ports on the product.
• Firmware — The firmware level running on the product.