
Brocade Network Advisor SAN User Manual v12.0.0 (53-1002696-01, April 2013)

212 Brocade Network Advisor SAN User Manual
53-1002696-01
Performance Dashboard monitors
8
• Double-click a row to navigate to the SAN Historical Graphs/Tables dialog box. For more
information, refer to “Performance Data” on page 895.
Top Port Link Resets monitor
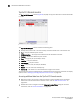
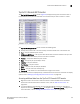
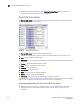
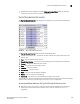
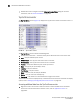
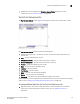
The Top Port Link Resets monitor (Figure 72) displays the top ports with link resets in a table.
FIGURE 72 Top Port Link Resets monitor
The Top Port Link Resets monitor includes the following data:
• Severity icon/monitor title — The color of the worst severity of the data shown next to the
monitor title.
• Port — The port affected by this monitor.
• RX Link Resets/sec — The top receive link resets in seconds.
• TX Link Resets/sec — The top transmit link resets in seconds.
• Product — The product affected by this monitor.
• Type — The type of port (for example, U-Port).
• Identifier — The port identifier.
• Port Number— The port number.
• State — The port state (for example, Enabled).
• Status — The port status (for example, Up).
• Refreshed — The refresh time and selected time range for the monitor.
To customize the monitor to display data by a selected time frame as well as customize the display
options, refer to “Editing a preconfigured performance monitor” on page 220.
Accessing additional data from the Top Port Link Resets monitor
• Right-click a row in the monitor to access the shortcut menu available for the associated
device. For more information about shortcut menus, refer to “Application menus” on
page 1061.