
Brocade Network Advisor SAN User Manual v12.0.0 (53-1002696-01, April 2013)
204 Brocade Network Advisor SAN User Manual
53-1002696-01
Performance Dashboard monitors
8
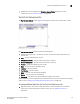
Customizing the VM Alarms widget
You can customize the VM Alarms widget to display data for a specific fabric and duration.
• Display data by fabric by selecting the fabric you want to monitor from the Show list.
Select All Fabrics to include all managed and monitored fabrics in your AOR. The default is All
Fabrics.
If the fabric you select is deleted from discovery, the widget refreshes and returns to the
default (All Fabrics).
• Display data for a specific duration by selecting one of the following from the Range list:
- Hour — Displays data for the current hour beginning when you launch the dashboard.
- 12 Hours — Displays data for the previous 12 hours to when you launch the dashboard.
- Day — Displays data for the current day beginning at 12:00 AM.
- Week — Displays data for the last 7 days, including the current day.
- 1 Month — Displays data for the last 30 days, including the current day.
Accessing additional data from the VM Alarms widget
• Right-click a row in the widget to access the shortcut menu available for the associated device.
For more information about shortcut menus, refer to “SAN shortcut menus” on page 1071.
• Double-click a row in the widget to navigate to the VM Troubleshooting - VM_Name
(Host_Name) dialog box (where VM_Name (Host_Name) is the name of the virtual machine
and associated host). For more information, refer to “Host Management” on page 403.
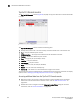
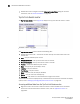
Performance Dashboard monitors
The Performance Dashboard provides a high-level overview of the performance on the network.
This allows you to easily check the performance of devices on the network. The Performance
Dashboard also provides several features to help you quickly access performance metrics and
reports.
The dashboards update every ten minutes regardless of the currently selected tab (SANor
Dashboard) or the SAN size.
You can change the default size of the status widgets and performance monitors by placing the
cursor on the divider until a double arrow displays. Click and drag the adjoining divider to resize the
window.
Reset the Performance Dashboard back to the default size by right-clicking in the white space and
selected Reset to Default.
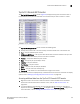
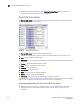
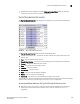
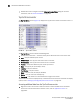
The Management application provides the following preconfigured performance monitors:
• Top Port C3 Discards — Table view of the C3 discards measure (All SAN FC port collector)
• Top Port C3 Discards RX TO — Table view of the C3 discards RX TO measure (All SAN FC port
collector)
• Top Port CRC Errors — Table view of the CRC errors measure (All SAN FC port collector, All SAN
TE port collector)